In November 2023, the ISM Manufacturing Index (PMI) remained steady at 46.7, mirroring the October figure and falling short of the anticipated 47.6, indicating a sustained contraction in the manufacturing sector (A PMI reading above 50 means expansion, while below 50 means contraction). Therefore, this month’s value indicates the twelfth consecutive contraction in the US manufacturing sector. Despite ongoing challenges with order softness, companies are strategically adjusting their outputs. Notably, production contracted further (48.5 compared to 50.4), and employment experienced a more pronounced decline (45.8 compared to 46.8). The Supplier Deliveries Index indicated accelerated deliveries for the 14th consecutive month (46.2 compared to 47.7). Conversely, new orders (48.3 compared to 45.5) and inventories (44.8 compared to 43.3) contracted at a slower rate, and prices exhibited a lesser decrease (49.9 compared to 45.1). This suggests a degree of price stability attributed to a relaxation in energy markets, although this was partially offset by rises in the steel markets. Despite these challenges, the reduction in manufacturing supplier lead times is a positive indicator for future economic activity.
The Conference Board Consumer Confidence Index rose to 102.0 (1985=100) in November, marking an increase from the downwardly revised figure of 99.1 in October. The Present Situation Index, reflecting consumers’ evaluation of current business and labor market conditions, experienced a slight decline to 138.2 (1985=100), down from 138.6. On the other hand, the Expectations Index, which gauges consumers’ short-term outlook for income, business, and labor market conditions, saw an uptick to 77.8 (1985=100) in November, compared to its downwardly revised reading of 72.7 in October. Despite the improvement this month, the Expectations Index has remained below 80 for a third consecutive month, a historical threshold indicating a potential recession within the next year. While concerns among consumers about an impending recession slightly diminished, reaching the lowest levels seen this year, approximately two-thirds of surveyed consumers in November still believe that a recession is “somewhat” or “very likely” to occur over the next 12 months.
“Consumer confidence increased in November, following three consecutive months of decline,” said Dana Peterson, Chief Economist at The Conference Board. “This improvement reflected a recovery in the Expectations Index, while the Present Situation Index was largely unchanged. November’s increase in consumer confidence was concentrated primarily among householders aged 55 and up; by contrast, confidence among householders aged 35-54 declined slightly. General improvements were seen across the spectrum of income groups surveyed in November. Nonetheless, write-in responses revealed consumers remain preoccupied with rising prices in general, followed by war/conflicts and higher interest rates.”
WTI Oil entered November at $80.100 per barrel. Prices peaked for the month on the 2nd at $82.160 per barrel then trended downward until the 16th when it hit its month low of $73.090 per barrel. Oil closed out the month at $75.960 per barrel. Over the past three sessions, oil prices experienced a decline of more than 6%, driven by skepticism regarding the effectiveness of OPEC+ supply cuts and concerns about weakened energy demand due to softening data in major economies. Recently, several OPEC+ members, including Saudi Arabia, the UAE, and Kuwait, announced additional voluntary cuts amounting to 2.2 million barrels per day. Some members have yet to confirm their commitments. The Saudi Arabian energy minister stated to Bloomberg on Monday that OPEC+ supply cuts can “absolutely” extend beyond the first quarter if necessary. Meanwhile, traders remained uneasy about the escalating geopolitical tensions in the Middle East, particularly the intensified fighting in Gaza over the weekend.
The online US Oil Rig Count is at 625 which is up 7 compared to last month’s report and down 159 from Dec 2 of 2022. This key and leading indicator shows the current demand for products used in drilling, completing, producing, and processing hydrocarbons which all of us use every day as fuel sources and finished products.
The number of rigs conducting oil and gas drilling in the United States continues to remain stagnant. This trend reflects the priority of drillers to focus on enhancing shareholder returns rather than expanding production coupled with the current administration’s desire to move away from fossil fuels. Additionally, uncertainty surrounds the economic outlook, leading the industry to remain cautious, especially compared to pre-pandemic times when the rig count showed a slower recovery over the past few years. To provide context, in 2019, 954 rigs were drilling for oil and gas in the U.S., and, in 2014, there were 1609 rigs before oil prices dropped below $20 per barrel at the end of that year.
However, solid oil prices will likely prevent the rig count from decreasing significantly and may even lead to a rebound in 2024. Currently, the West Texas Intermediate benchmark prices have been at around $75 per barrel, which is sufficient for most drillers to be profitable. Consequently, the U.S. is still expected to set a new annual oil production record in 2023, with a projected 12.4 million barrels per day, slightly surpassing the 2019 record of 12.3 million bpd.
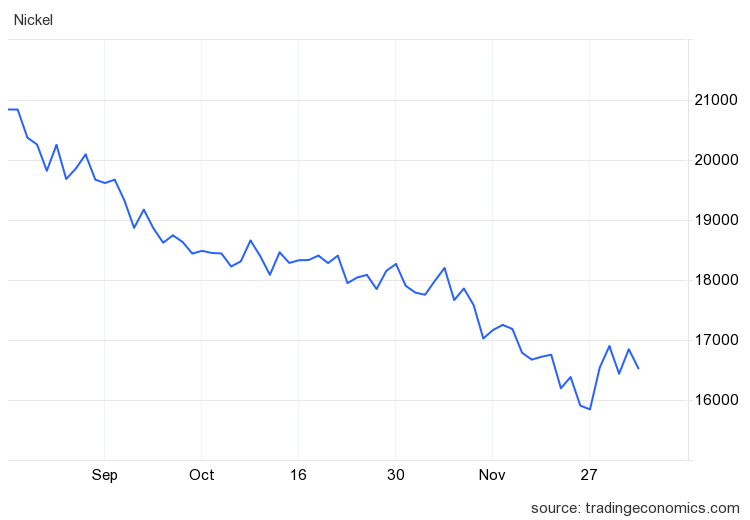
Nickel continued its general downward slide as we entered November starting the month off at $8.069 per pound and peaking on November 6th at $8.255 per pound then returning on its slide until the 27th where it hit a 3 year low of $7.186 per pound. Nickel then ticked up slightly before closing out the month at $7.456 per pound. We are experiencing two year lows amid a worsened demand outlook triggered by fears of elevated interest rates, as inflationary pressures persist. Simultaneously, the electric vehicle sector experienced a downturn, with manufacturers of batteries for new EVs gradually curtailing their input buying activity since the onset of the third quarter. The metal found some support in the full-year nickel production guidance cuts by giant Glencore. Glencore lowered its forecast for 2023 nickel output by 9% to around 102,000 tons, mainly due to maintenance outages at the Sudbury smelter and a longer than expected recovery from the 2022 strike action. Still, the market faced the largest demand-supply surplus in at least a decade.
Below is the 90 day Nickel Price Trend (US$ per tonne).

Commodity stainless plate deliveries have pulled in once again on certain grades and sizes to a 7 to 9 week range. Nickel alloy plates pulled in to the 8 to 9 week range. Duplex plates are currently sitting in the 7 to 9 week range. Carbon steel plate mill deliveries are scheduling in the 6 to 10 week range. Nucor released a base price increase at the return of the Thanksgiving Holiday. This came shortly after a prior base price increase. Keep in mind some plates will exceed the estimated ranges depending on the mill’s production schedule with the upcoming holidays and planned shutdowns.
Welded tubing – Currently deliveries for domestically welded stainless tubing are in the 6 to 12 week range, whether small or large quantities (Up to 26 weeks for import). Carbon steel tubing deliveries have lead times ranging anywhere from 6 to 12 weeks when strip is available. Welded nickel alloy tubing ranges from 8 to 14 weeks (up to 42 weeks for imports). There has been a decrease across the board in tubing lead times as domestic and foreign mills are looking for more work.
Seamless tubing – Current schedules reflect 10 to 20 weeks or more for carbon steel (24 to 26 weeks for Western European carbon seamless) and 10 to 35 weeks for stainless. Seamless nickel tubing is being offered at the 10 to 14 week delivery window so long as hollows are in stock. If hollows are not readily available, anticipate deliveries of seamless nickel tubing in the 20 to 32 week timeframe.
Please don’t hesitate to reach out if you have any questions about the current state of our industry’s material supply chain.
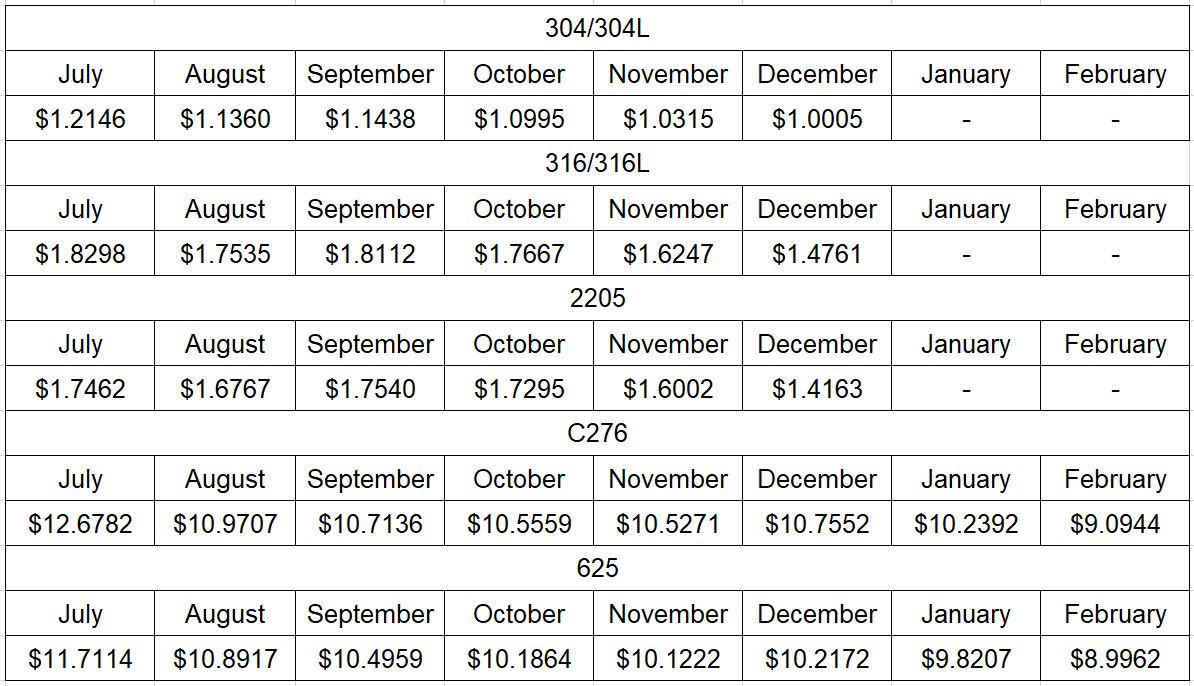
Here’s the current surcharge chart for 304/304LSS, 316/316LSS, 2205, C276, and 625.

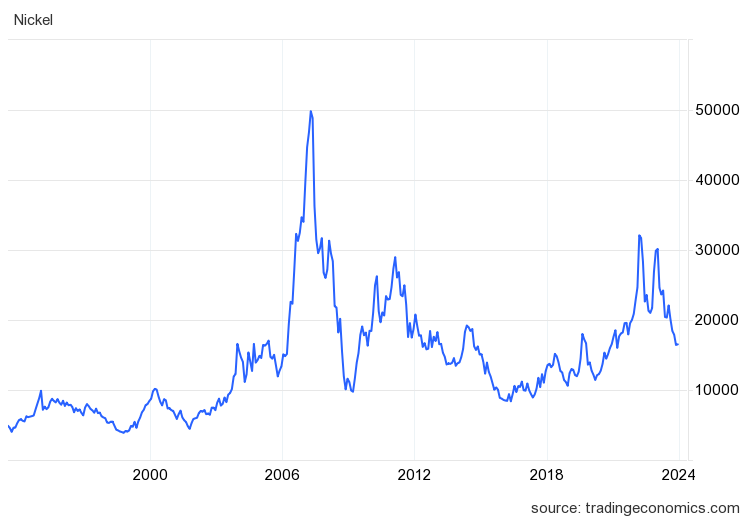
Nickel Prices have had an interesting ride over the past two decades with a low of $2.20/lb. in October of 2001 (following September 11 events) and a high of $23.72/lb. in May of 2007. Surcharges trail Nickel prices by approximately two months, so they would have been at their lowest in December of 2001 (304 was $0.0182/lb.) with the peak in July of 2007 (304 was $2.2839/lb.).
The chart below illustrates Nickel price by way of U.S. Dollars per Metric ton.

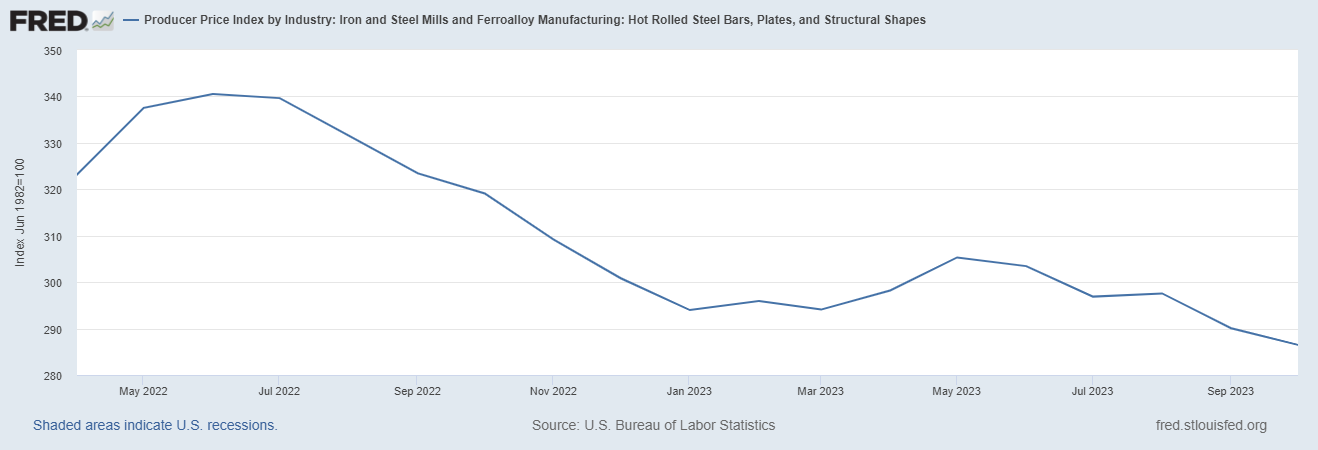
Here’s the Price Index for Hot Rolled Bars, Plate, and Structural Shapes.


