The January 2024 ISM Manufacturing Index (PMI) in the US showed improvement, reaching 49.1, the highest since October 2022, up from December’s 47.1 and surpassing the expected 47. Despite indicating a continued contraction in the manufacturing sector, the pace was notably softer. This was attributed to a moderate improvement in demand, stable output, and accommodating inputs. Notably, new orders (52.5 vs 47) and production (50.4 vs 49.9) experienced rebounds, while the decline in inventories was less pronounced (46.2 vs 43.9). Additionally, the supplier deliveries index indicated quicker deliveries for the 16th consecutive month (49.1 vs 47), and the customers’ inventories index contracted further (43.7 vs 48.1), signaling increased accommodation for future production. However, employment slightly decreased (47.1 vs 47.5), backlogs of orders diminished at a faster rate (44.7 vs 45.3), and price pressures rose (52.9 vs 45.2).
In January, the Consumer Confidence Index, as reported by The Conference Board, increased to 114.8, surpassing the revised December figure of 108.0. This reading represented the highest level since December 2021 and marked the third consecutive monthly rise. The Present Situation Index, reflecting consumers’ evaluations of current business and labor market conditions, surged from 147.2 in the previous month to 161.3. Additionally, the Expectations Index, which gauges consumers’ short-term outlook on income, business, and labor market conditions, improved to 83.8 in January, up from the revised reading of 81.9 in December.
“January’s increase in consumer confidence likely reflected slower inflation, anticipation of lower interest rates ahead, and generally favorable employment conditions as companies continue to hoard labor,” said Dana Peterson, Chief Economist at The Conference Board. “The gain was seen across all age groups, but was largest for consumers 55 and over. Likewise, confidence improved for all income groups except the very top; only households earning $125,000+ saw a slight dip. January’s write-in responses revealed that consumers remain concerned about rising prices although inflation expectations fell to a three-year low. Buying plans dipped in January, but consumers continued to rate their income and personal finances favorably currently and over the next six months. Consumers’ Perceived Likelihood of a US Recession over the Next 12 Months continued to gradually ease in January, consistent with an Expectations Index rising above 80.”
WTI Oil entered January at $70.380 per barrel. Prices bounced around for a few days then rose until the monthly high of $78.010 per barrel on January 26th. Oil trended down for the last few days of the month, closing out January at $75.850 per barrel. Last week, oil prices plunged more than 7% as progress in ceasefire negotiations between Israel and Hamas eased concerns about supply disruptions from the region. Fading expectations of immediate interest rate cuts from the US Federal Reserve and persistent concerns about China’s economic recovery also weighed on the global demand outlook. Meanwhile, the US said that it will conduct further military action against Iran-backed groups, raising tensions in the Middle East although insisting that it is not seeking a wider conflict in the region.
The online US Oil Rig Count is at 619 which is down 2 compared to last month’s report and down 140 from Jan 27 of 2023. This key and leading indicator shows the current demand for products used in drilling, completing, producing, and processing hydrocarbons which all of us use every day as fuel sources and finished products.
The number of rigs conducting oil and gas drilling in the United States continues to remain stagnant. This trend reflects the priority of drillers to focus on enhancing shareholder returns rather than expanding production coupled with the current administration’s desire to move away from fossil fuels. Additionally, uncertainty surrounds the economic outlook, leading the industry to remain cautious, especially compared to pre-pandemic times when the rig count showed a slower recovery over the past few years. To provide context, in 2019, 954 rigs were drilling for oil and gas in the U.S., and, in 2014, there were 1609 rigs before oil prices dropped below $20 per barrel at the end of that year.
However, solid oil prices will likely prevent the rig count from decreasing significantly and may even lead to a rebound in 2024. Currently, the West Texas Intermediate benchmark prices have been at around $75 per barrel, which is sufficient for most drillers to be profitable.
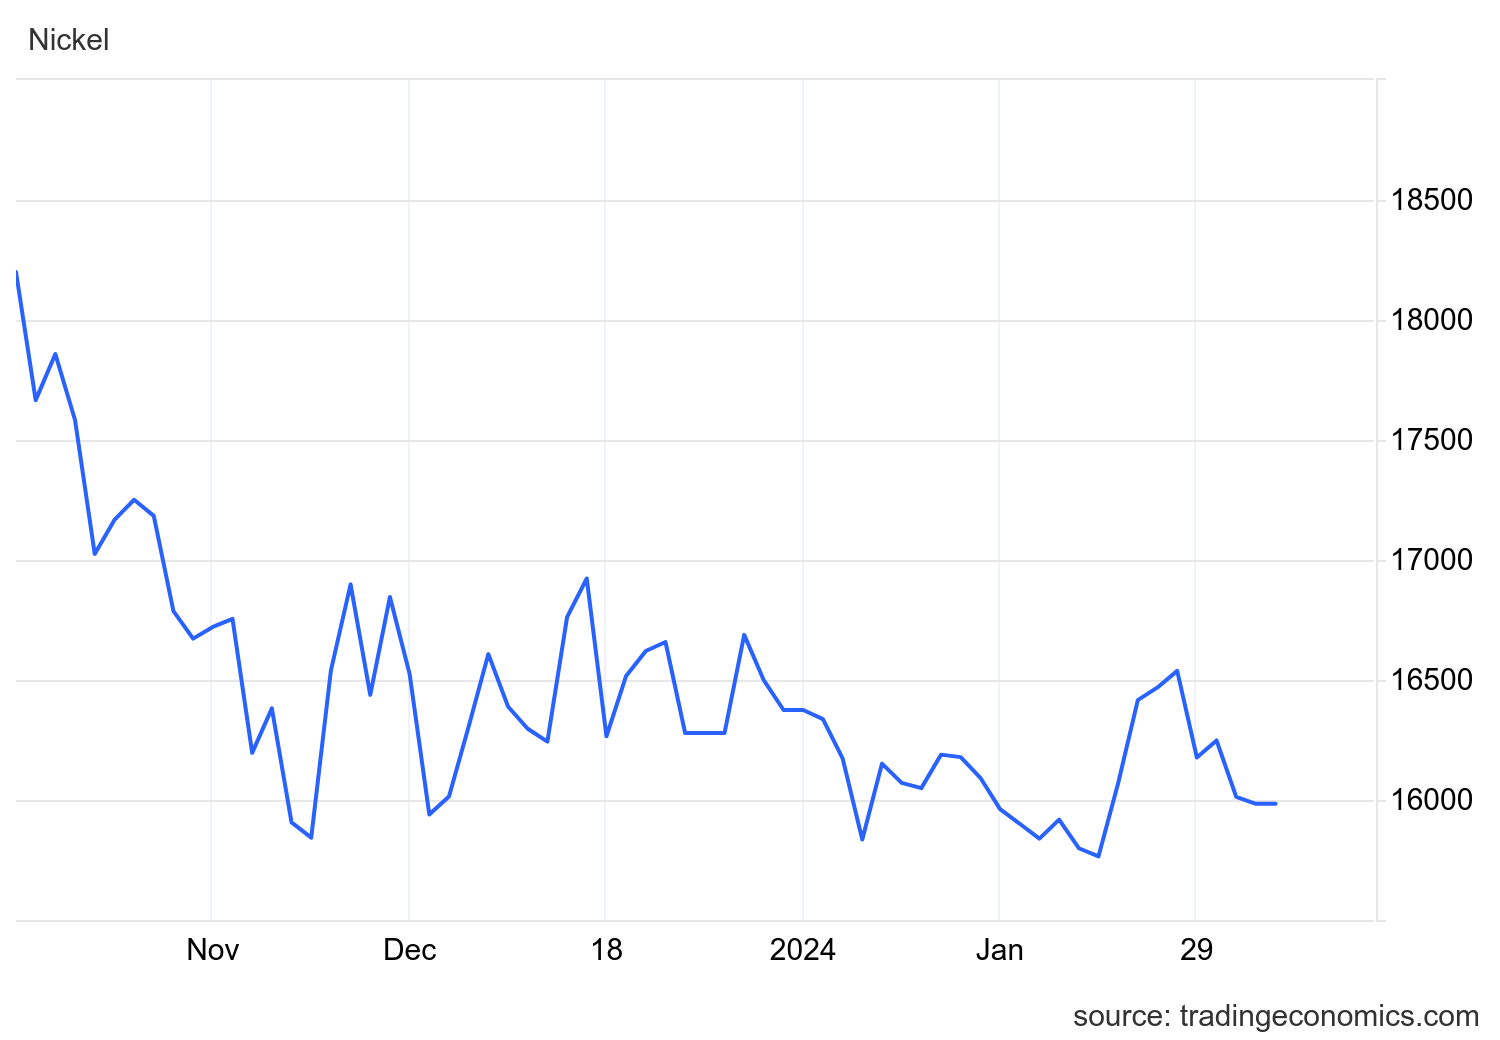
Nickel began January at $7.428 per pound. By the 22nd, prices fell to $7.151 per pound, a three year low for Nickel. Nickel closed the month out at $7.263 per pound. Overall, Nickel did not have an inspiring month, which is welcomed after the volatility we have seen over the past few years. China’s government signaled a cut in its reserve requirement ratio in the coming two weeks, which is set to provide CNY 1 trillion in liquidity. Additionally, the key producer Nornickel stated its output was projected to drop again this year amid geopolitical risks and the planned capital repairs of the flash smelting furnace #2 at Nadezhda Metallurgical Plant. Still, the overall trend for the commodity remained bearish due to continued growth in LME inventories since September and robust supply from the world’s leading exporters, Indonesia, Philippines, and China. According to the International Nickel Study Group forecast, the metal’s supply surpassed demand by 223,000 metric tons in 2023, and the gap is expected to widen to 239,000 metric tons in 2024.
Below is the 90 day Nickel Price Trend (US$ per tonne).

Commodity stainless plate deliveries have pulled in yet again on certain grades and sizes to a 6 to 8 week range. Nickel alloy plates pulled into the 7 to 8 week range. Duplex plates bump out by a week, sitting in the 8 to 9 week range. Carbon steel plate mill deliveries are scheduling in the 5 to 8 week range. Keep in mind, that some plates will exceed the estimated ranges depending on the mill’s production schedule.
Welded tubing – Currently deliveries for domestically welded stainless tubing are in the 6 to 12 week range, whether in small or large quantities. For import tubes, deliveries are anywhere from 18 to 26 weeks. Carbon steel tubing deliveries have lead times ranging anywhere from 6 to 12 weeks when strip material is available. Welded nickel alloy tubing ranges from 8 to 14 weeks (up to 42 weeks for imports).
Seamless tubing – Current schedules reflect 10 to 20 weeks or more for carbon steel (24 to 26 weeks for Western European carbon seamless) and 10 to 35 weeks for stainless. Seamless nickel tubing is being offered at the 10 to 14 week delivery window so long as hollows are in stock. If hollows are not readily available, anticipate deliveries of seamless nickel tubing in the 20 to 32 week timeframe.
Please don’t hesitate to reach out if you have any questions about the current state of our industry’s material supply chain.
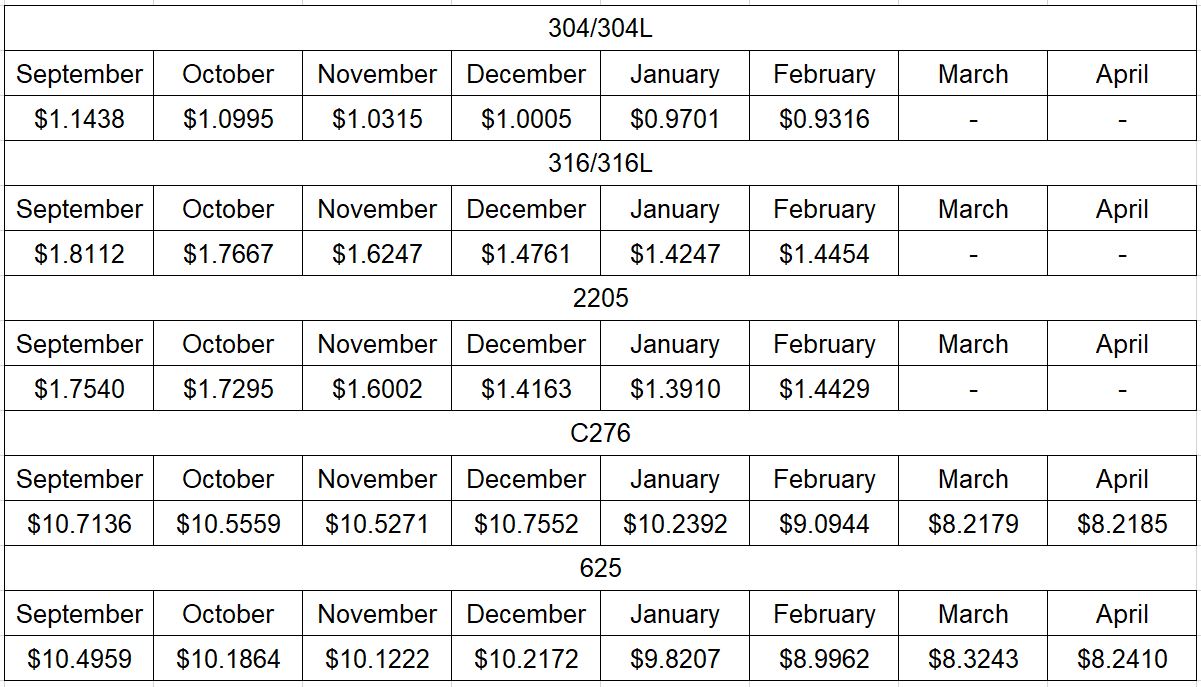
Here’s the current surcharge chart for 304/304LSS, 316/316LSS, 2205, C276, and 625.

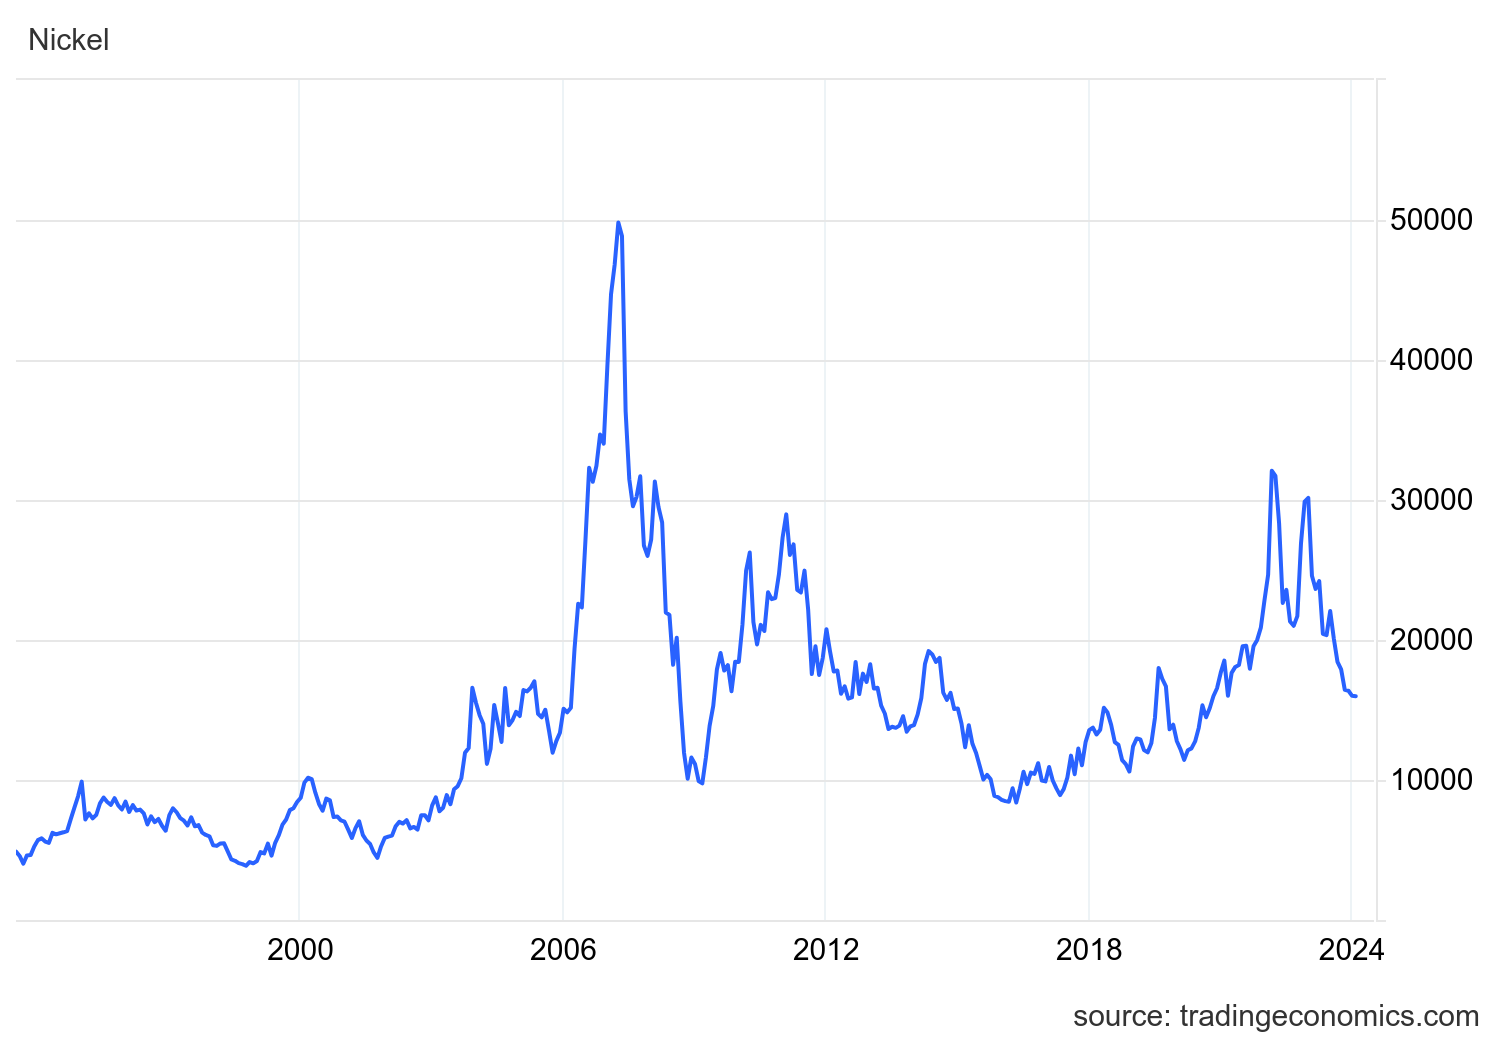
Nickel Prices have had an interesting ride over the past two decades with a low of $2.20/lb. in October of 2001 (following September 11 events) and a high of $23.72/lb. in May of 2007. Surcharges trail Nickel prices by approximately two months, so they would have been at their lowest in December of 2001 (304 was $0.0182/lb.) with the peak in July of 2007 (304 was $2.2839/lb.).
The chart below illustrates Nickel price by way of U.S. Dollars per Metric ton.

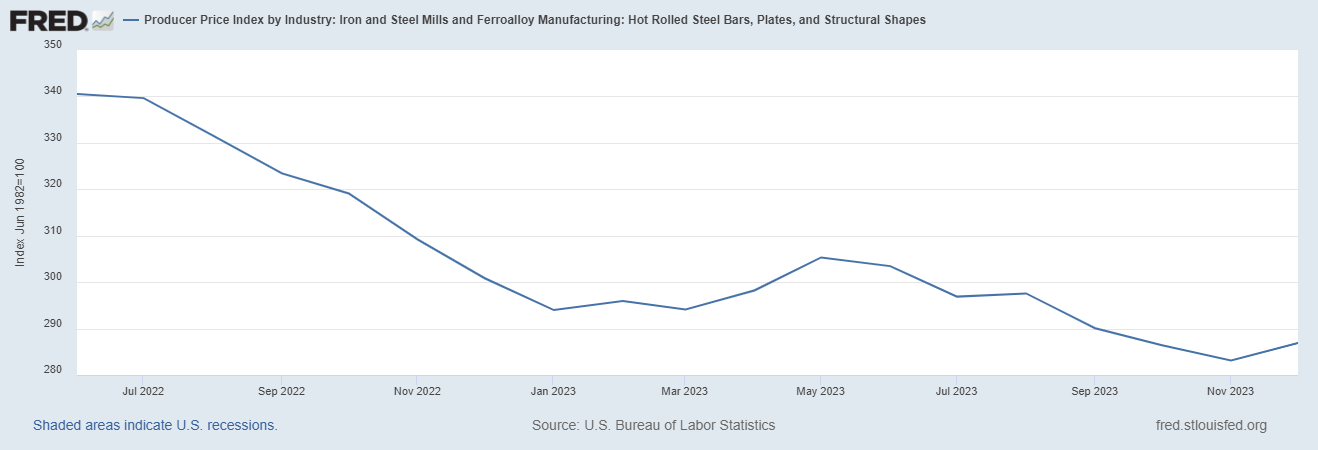
Here’s the Price Index for Hot Rolled Bars, Plate, and Structural Shapes.


