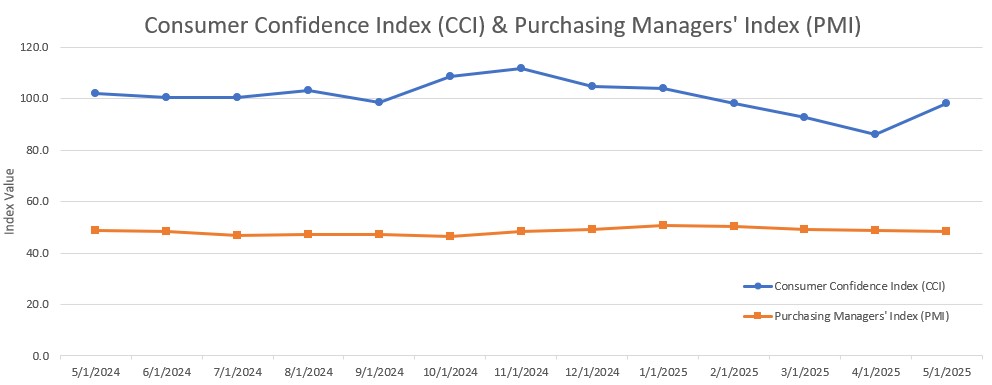
The ISM Manufacturing PMI registered 48.5 percent in May, 0.2 percentage point lower compared to the 48.7 percent recorded in April. The overall economy continued in expansion for the 61st month after one month of contraction in April 2020. (Important data point reference: A Manufacturing PMI reading above 50 percent indicates that the manufacturing economy is generally expanding; below 50 percent indicates that it is generally declining. A Manufacturing PMI above 42.5 percent, over a period of time, indicates that the overall economy, or gross domestic product (GDP), is generally expanding; below 42.5 percent, it is generally declining. The distance from 50 percent or 42.5 percent is indicative of the extent of the expansion or decline.)
The Conference Board Consumer Confidence Index increased by 12.3 points in May to 98.0 (1985=100), up from 85.7 in April.
Other Notable Indexes:
New Orders: 47.6 (from 47.2)
Production: 45.4 (from 44)
Prices: 69.4 (from 69.8)
Backlog of Orders: 47.1 (from 43.7)
Employment: 46.8 (from 46.5)
Present Situation: 135.9 (from 133.5)
Expectations: 72.8 (from 54.4)
The Consumer Price Index (CPI, otherwise known as our “inflation” friend) is currently at 2.3% as of April 2025, down from 2.4% in March 2025. CPI tracks the rate of change in US inflation over time, and the following shows the trends over the past 20 years.

WTI Crude Oil futures rose above $64 per barrel on Friday, boosted by a stronger-than-expected US jobs report that eased economic concerns and supported demand outlooks. Tensions between President Trump and Elon Musk also appeared to ease, while a planned US-China trade meeting is expected within a week, adding optimism. Wildfires in Canada temporarily cut about 7% of the country’s oil output, though recent rain helped control the fires. Meanwhile, Saudi Arabia signaled plans to push OPEC+ for a significant production increase, urging at least 411,000 barrels per day more in August and possibly September to meet summer demand. These factors helped oil prices recover, with WTI heading for a 6% weekly gain after two weeks of declines.
WTI Crude Oil Pricing ($/Bbl):
May 1st: 59.24 (enter)
May 3rd: 57.13 (monthly low)
May 13th: 63.67(monthly high)
May 30th: 60.79 (exit)
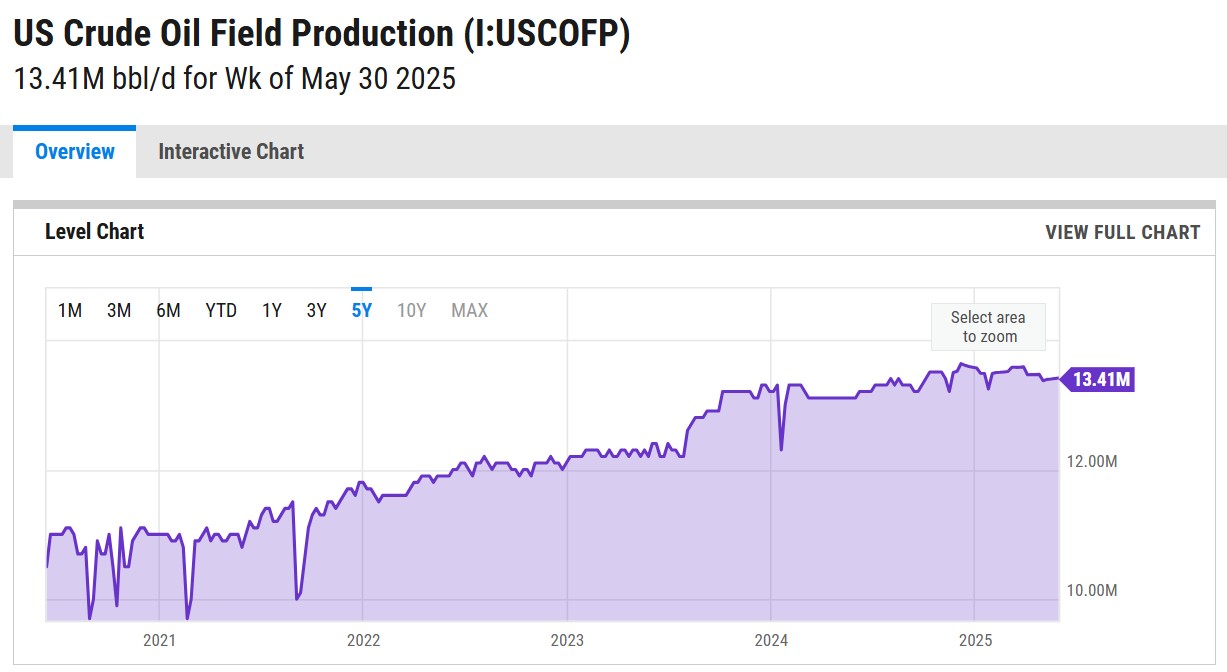
The online US Oil Rig Count is currently reported as 559 which is ??25 compared to last month’s report and ??35 from June 7 of 2024. This key and leading indicator shows the current demand for products used in drilling, completing, producing, and processing hydrocarbons, which all of us use every day as fuel sources and finished products.
The number of rigs conducting oil and gas drilling in the United States continues to remain stagnant but efficiency has increased a lot over the years, as you can see from the chart below. We are drilling at record production levels. This trend of fewer rigs however still reflects the priority of drillers to focus on efficiency and enhancing shareholder returns rather than expanding production through capital investments due to the previous administration’s desire to move away from fossil fuels. This philosophy might be changing now that the Trump administration is fully behind fossil fuels. To provide context, in 2019, 954 rigs were drilling for oil and gas in the US, and, in 2014, there were 1609 rigs before oil prices dropped below $20 per barrel at the end of that year.
Tariffs have tightened, untightened, and will continue to evolve as the Trump administration navigates global negotiations.
Whew… there’s A LOT to unpack here, so hold on for the roller coaster ride.
A little background on where all of this started and what it means. Tariffs are duties placed on foreign goods, paid by domestic importers to Customs and Border Patrol at ports of entry. President Trump introduced tariffs on select Chinese goods in his first term, which President Joe Biden later maintained, along with duties on steel and aluminum from most countries. In February, Trump reinstated tariffs—10% more on Chinese imports, bringing them to 35%, and 25% on Mexican and Canadian goods (except for oil, taxed at 10%). However, these tariffs on Canada and Mexico were temporarily paused after both countries reaffirmed commitments to border security cooperation with the U.S.
Just after midnight on Tuesday, March 4th, President Donald Trump imposed 25% tariffs on all Mexican and Canadian imports, with a lower 10% tariff on Canadian energy. He also doubled existing tariffs on Chinese products to 20%, on top of the old 25% tariff. In response, China imposed up to 15% tariffs on some U.S. imports, while Canada introduced a 25% levy. Mexican President Claudia Sheinbaum announced that Mexico would impose tariffs on U.S. goods by Sunday but did not provide details.
On Thursday, March 6th, President Trump announced a pause on tariffs for all Mexican and Canadian imports covered under the United States–Mexico–Canada Agreement (USMCA) until April 2.
President Trump defended the new tariffs as a measure to correct the trade deficit and curb fentanyl trafficking from China, Canada, and Mexico. “It may take some adjusting,” he told Congress on Tuesday, “but trust me, this will be even better.”
On April 2nd, 2025 – dubbed “Liberation Day”, the United States implemented significant changes to its tariff policies under President Donald Trump.?
- Universal 10% Tariff: Effective April 5, a baseline 10% tariff has been imposed on all imported goods, with exceptions for Canada and Mexico.
- Country-Specific Tariffs: Starting April 9, higher tariffs will target specific countries based on trade imbalances and perceived unfair practices. Notable examples include:?
- China: An additional 34% tariff, totaling 54% when combined with existing duties.
- Vietnam: 46% tariff.?
- European Union: 20% tariff.
As of June 9th, 2025, we are looking at the following.
Tariff levels – Steel/aluminum: 50%; autos: 25%; China: 20–125%
Legal status – Court setbacks, but administration is appealing
Trade tensions – Ongoing with EU, Canada, Mexico, China; India lodged WTO complaint
Diplomacy – U.S.–China talks active in London; EU window until July 9
Economic impact – Deficit drop vs. slower growth and rising inflation
China’s exports to the U.S. saw their sharpest decline since 2020 this May. As U.S. and Chinese officials meet in London this week in an effort to ease trade tensions, the stakes are high. Last month, Chinese exports to the U.S. dropped 34.5%—the largest fall since February 2020, when COVID-19 disruptions crippled China’s economy and global supply chains. This decline came despite a temporary trade deal reached on May 12, which reduced—but did not eliminate—tariffs for a 90-day period. During the ongoing discussions, which began yesterday, China is pressing for reduced tariffs and improved access to American technology, while the U.S. is pushing for increased exports of Chinese rare earth minerals. Following the first day of talks, Trump described China as “not easy,” but added that he’s “only getting good reports.”
Stay tuned as this saga continues to unfold…
The impact of these tariffs will be interesting to see unfold and could be significant for U.S.-based manufacturers of pressure vessels and heat exchangers. Many of these manufacturers rely on imported raw materials and components. The imposed tariffs will lead to higher costs for these imports, potentially disrupting supply chains and increasing production expenses. Manufacturers will need to properly evaluate their supplier base to ensure they stay as competitive as possible.
While the tariffs may increase raw materials and components costs, they will also provide a much more competitive advantage for U.S.-based pressure vessel and heat exchanger manufacturers. The government effectively makes imported products more expensive by imposing tariffs on foreign-made pressure vessels and heat exchangers. This could lead to several potential benefits for domestic manufacturers: reduced foreign competition, increased market share, encouragement for domestic investment, potential price stabilization in our market, and a boost in government and industrial contracts. Overall, it boosts the purchase of American-made products, which is good for American workers.
In summary, while the tariffs aim to help and protect domestic industries, they will pose challenges for U.S.-based pressure vessel and heat exchanger manufacturers by increasing operational costs and complicating supply chain logistics. However, the benefits can outweigh the drawbacks and will depend highly on how well domestic manufacturers adapt to increased material costs and whether demand shifts significantly in their favor. If manufacturers can efficiently manage costs and scale production, they could gain long-term advantages from the trade policies.
The administration has published this fact sheet (click here) on the White House website.
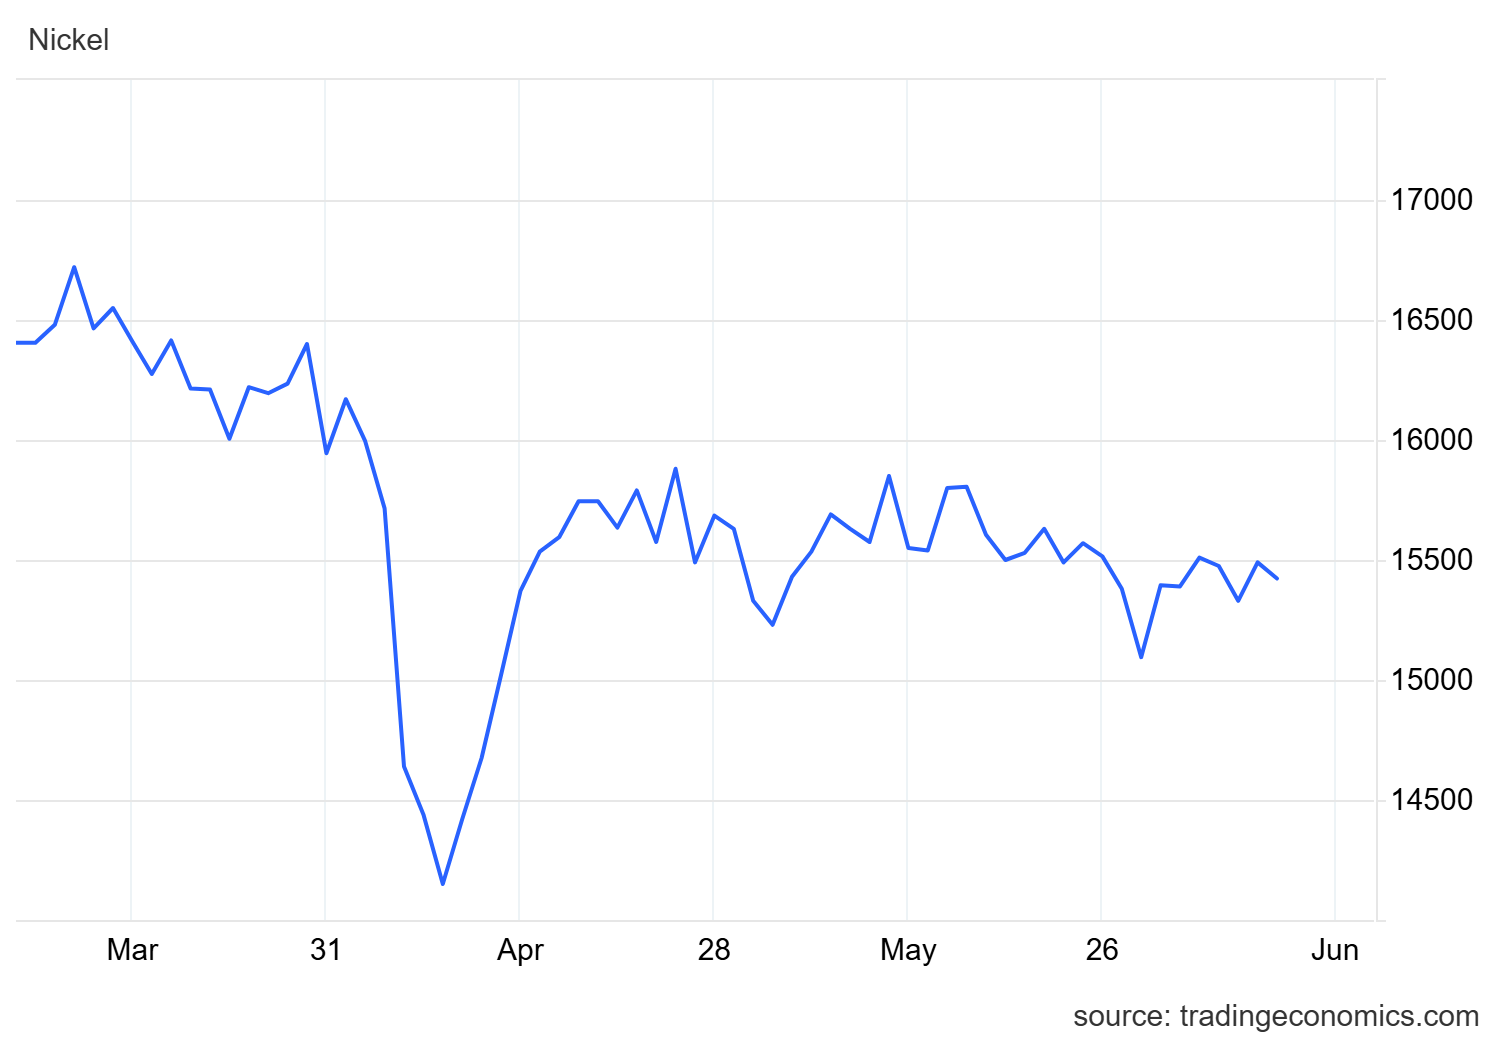
Nickel futures are remaining within a multi-week range and close to the over four-year low of $6.418 reached in April, as oversupply concerns persisted despite Indonesia’s recent push for stricter ESG standards. The launch of Indonesia’s first national ESG forum signals a shift toward more sustainable nickel production, aiming to meet tightening global environmental regulations. While this initiative could tighten supply over the long term, near-term output remains strong, with Indonesia continuing to dominate the market. Earlier this year, the Indonesian government cut nickel mining quotas by 120 million tons to 150 million tons, reducing global supply by about 35%, amid a surge in Chinese-backed smelters following Indonesia’s 2020 ban on nickel ore exports. Indonesia now hosts 44 smelters, up from just four a decade ago. Meanwhile, uncertainty over US tariffs added further pressure on base metals.
Nickel Pricing ($/lb):
May 1st: 6.908 (enter)
May 9th: 7.189 (monthly high)
May 28th: 6.847 (monthly low)
May 30th: 6.981 (exit)
Plate mill plate lead times (weeks):
Domestic:
Stainless: 4 to 6 (was 4 to 8)
Duplex: 4 to 6 (was 4 to 8)
Nickel Alloys: 6 to 12 (was 8 to 14)
Carbon steel: 8 to 11(was 9 to 13)
*Keep in mind, some plates will exceed the estimated ranges depending on the mill’s production schedule and slab availability.*
Welded tubing lead times (weeks):
Domestic:
Carbon: 6 to 16 (no change)
Stainless: 8 to 12 (no change)
Nickel Alloy: 8 to 16 (no change)
Import:
Carbon: 14 to 25 (no change)
Stainless: 16 to 30 (no change)
Nickel Alloy: 16 to 42 (no change)
Seamless tubing lead times (weeks):
Domestic:
Carbon: 6 to 26 (no change)
Stainless: 8 to 26 (no change)
Nickel Alloy: 12 to 18 (no change)
*Lead times are accurate if hollows are in stock. If not, lead times can increase to 44 weeks as most hollows are of foreign melt.*
At Ward, our focus remains clear — delivering high-quality equipment and projects on time while providing an exceptional fabrication experience. We’re committed to transparency, collaboration, and smart solutions in the face of evolving market conditions. As always, we want to work through these challenges together, so let us know your thoughts. Please don’t hesitate to reach out if you have any questions about the current state of our industry’s material supply chain.
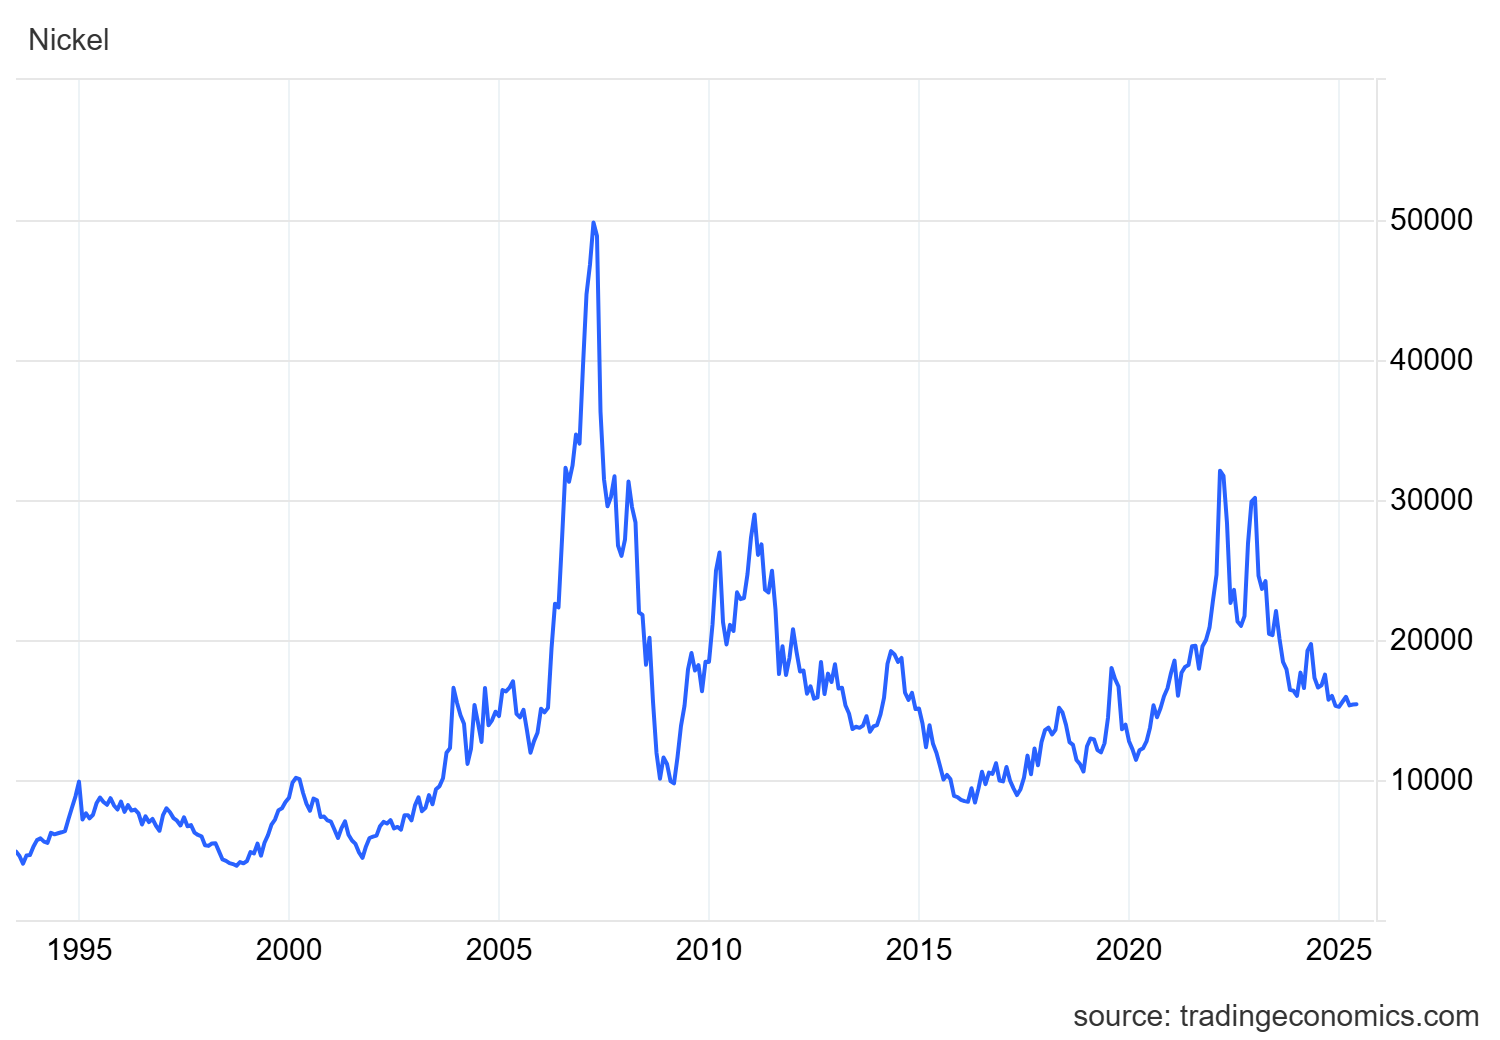
Below is the 90-day Nickel Price Trend (US$ per tonne).
Here’s the current surcharge chart for 304/304LSS, 316/316LSS, 2205, C276, and 625.
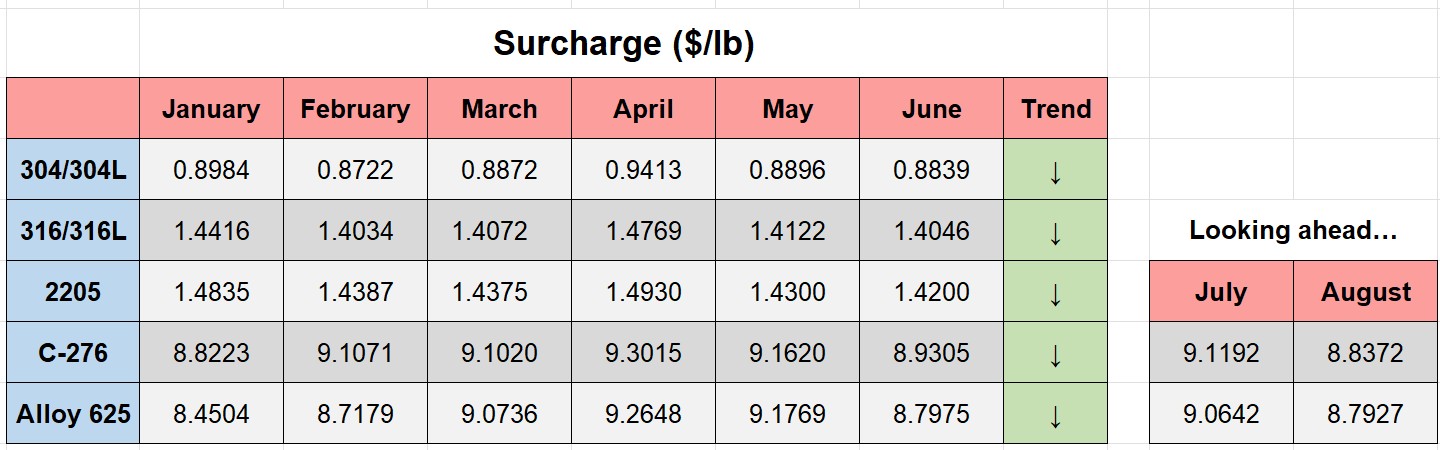
Nickel Prices have had an interesting ride over the past two decades with a low of $2.20/lb. in October of 2001 (following September 11 events) and a high of $23.72/lb. in May of 2007. Surcharges trail Nickel prices by approximately two months, so they would have been at their lowest in December of 2001 (304 was $0.0182/lb.) with the peak in July of 2007 (304 was $2.2839/lb.).
The chart below illustrates Nickel price by way of U.S. Dollars per Metric ton.
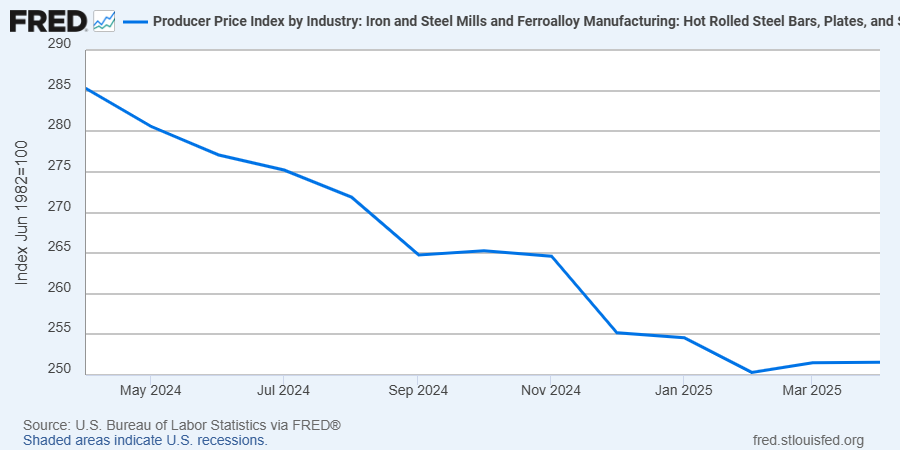
Here’s the Price Index for Hot Rolled Bars, Plate, and Structural Shapes.