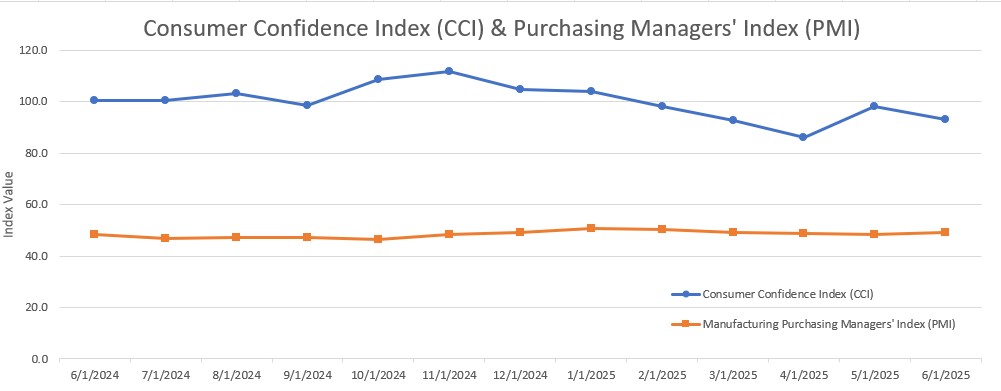
The ISM Manufacturing PMI registered 49 percent in June, a 0.5-percentage point increase compared to the 48.5 percent recorded in May. The overall economy continued in expansion for the 62nd month after one month of contraction in April 2020. (Important data point reference: A Manufacturing PMI reading above 50 percent indicates that the manufacturing economy is generally expanding; below 50 percent indicates that it is generally declining. A Manufacturing PMI above 42.5 percent, over a period of time, indicates that the overall economy, or gross domestic product (GDP), is generally expanding; below 42.5 percent, it is generally declining. The distance from 50 percent or 42.5 percent is indicative of the extent of the expansion or decline.)
The Conference Board Consumer Confidence Index deteriorated by 5.4 points in June, falling to 93.0 (1985=100) from 98.4 in May.
Other Notable Indexes:
New Orders: 46.4 (from 47.6)
Production: 50.3 (from 45.4)
Prices: 69.7 (from 69.4)
Backlog of Orders: 44.3 (from 47.1)
Employment: 45.0 (from 46.8)
Present Situation: 129.1 (from 135.9)
Expectations: 69.0 (from 72.8)
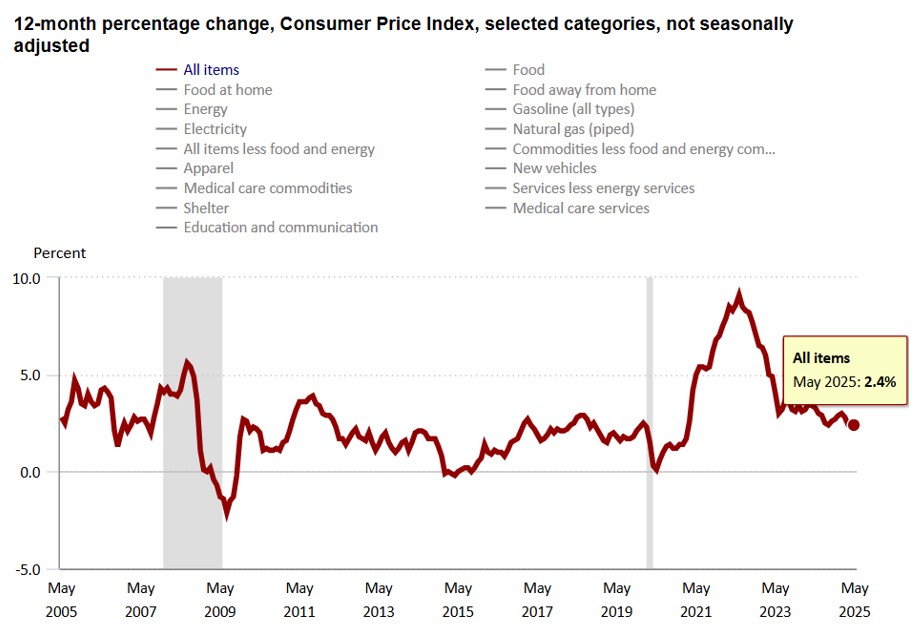
The Consumer Price Index (CPI, otherwise known as our “inflation” friend) is currently at 2.4% as of April 2025, up from 2.3% in April 2025. CPI tracks the rate of change in US inflation over time, and the following shows the trends over the past 20 years.
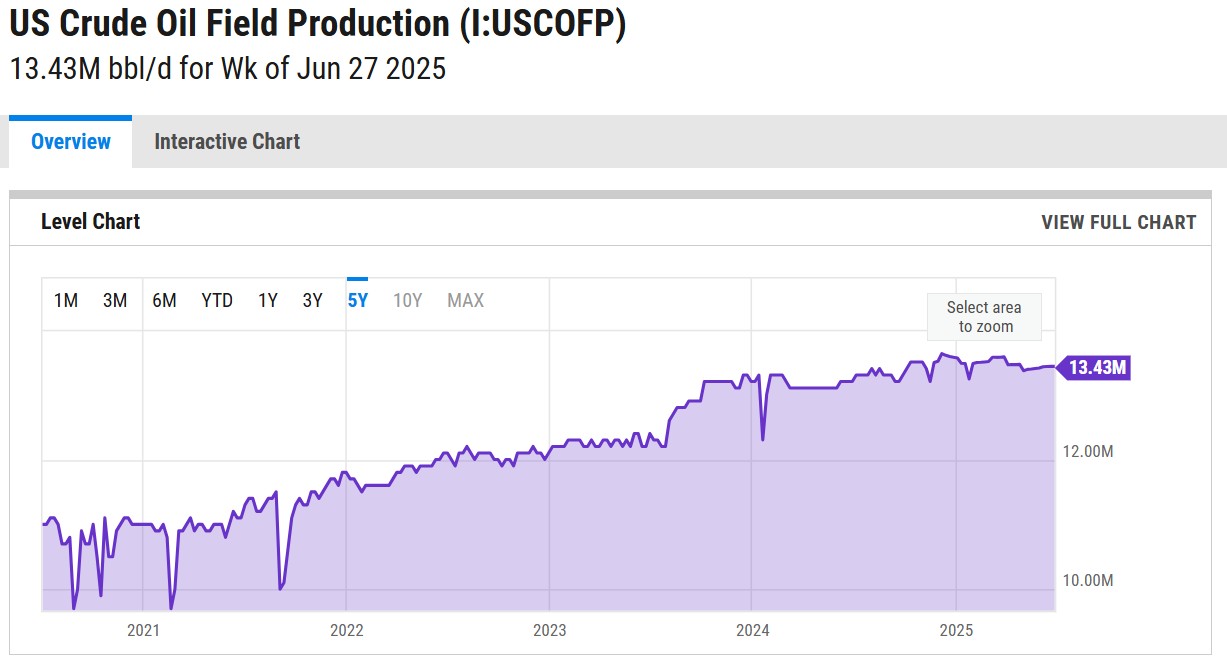
WTI crude oil futures fell below $67 per barrel on Thursday, trimming gains from the previous session, as a build in US crude stockpiles spurred concerns over weak demand from the key consumer. Official data showed crude inventories rose by 3.85 million barrels last week, defying forecasts for a 2 million barrel decline and marking the largest increase in three months. Adding to the pressure, OPEC+ also appears set to raise production by 411,000 bpd in August, bringing 2025’s total increase to 1.78 million bpd, equivalent to over 1.5% of global demand. Meanwhile, oil prices climbed more than 3% on Wednesday after Iran halted cooperation with the UN nuclear watchdog, adding a modest risk premium despite no actual supply disruptions. Adding further support, the US announcement of a trade deal with Vietnam reduced trade risks and boosted optimism for further negotiations that could influence energy outlook, with hopes for additional agreements before next week’s deadline.
WTI Crude Oil Pricing ($/Bbl):
June 2nd: 62.52 (enter, monthly low)
June 20th: 73.84 (monthly high)
June 30th: 65.11 (exit)
The online US Oil Rig Count is currently reported as 539 which is ??20 compared to last month’s report and ??46 from July 5 of 2024. This key and leading indicator shows the current demand for products used in drilling, completing, producing, and processing hydrocarbons, which all of us use every day as fuel sources and finished products.
The number of rigs conducting oil and gas drilling in the United States continues to remain stagnant but efficiency has increased a lot over the years, as you can see from the chart below. We are drilling at record production levels. This trend of fewer rigs however still reflects the priority of drillers to focus on efficiency and enhancing shareholder returns rather than expanding production through capital investments due to the previous administration’s desire to move away from fossil fuels. This philosophy might be changing now that the Trump administration is fully behind fossil fuels. To provide context, in 2019, 954 rigs were drilling for oil and gas in the US, and, in 2014, there were 1609 rigs before oil prices dropped below $20 per barrel at the end of that year.
Tariffs have tightened, untightened, and will continue to evolve as the Trump administration navigates global negotiations.
Whew… there’s A LOT to unpack here, so hold on for the roller coaster ride.
A little background on where all of this started and what it means. Tariffs are duties placed on foreign goods, paid by domestic importers to Customs and Border Patrol at ports of entry. President Trump introduced tariffs on select Chinese goods in his first term, which President Joe Biden later maintained, along with duties on steel and aluminum from most countries. In February, Trump reinstated tariffs—10% more on Chinese imports, bringing them to 35%, and 25% on Mexican and Canadian goods (except for oil, taxed at 10%). However, these tariffs on Canada and Mexico were temporarily paused after both countries reaffirmed commitments to border security cooperation with the U.S.
As of July 8th, 2025 at 11:15 am, we are looking at the following.
The Trump administration has extended the July 9th deadline expiration of key tariff rates to August 1, 2025, as part of a broader push for reciprocal trade practices. This move is expected to impact global supply chains and pricing in the metals and manufacturing sectors.
Key Developments
– New tariff rates will take effect August 1, including increases on imports from countries such as Japan (25%), South Korea (25%), and South Africa (30%).
– The administration has justified these measures by citing persistent trade imbalances and foreign tariff barriers.
– Some of the tariffs are currently under review by the U.S. Court of International Trade, which introduces uncertainty about their long-term enforcement.
Stay tuned as this saga continues to unfold…
The impact of these tariffs will be interesting to see unfold and could be significant for U.S.-based manufacturers of pressure vessels and heat exchangers. Many of these manufacturers rely on imported raw materials and components. The imposed tariffs will lead to higher costs for these imports, potentially disrupting supply chains and increasing production expenses. Manufacturers will need to properly evaluate their supplier base to ensure they stay as competitive as possible.
While the tariffs may increase raw materials and components costs, they will also provide a much more competitive advantage for U.S.-based pressure vessel and heat exchanger manufacturers. The government effectively makes imported products more expensive by imposing tariffs on foreign-made pressure vessels and heat exchangers. This could lead to several potential benefits for domestic manufacturers: reduced foreign competition, increased market share, encouragement for domestic investment, potential price stabilization in our market, and a boost in government and industrial contracts. Overall, it boosts the purchase of American-made products, which is good for American workers.
In summary, while the tariffs aim to help and protect domestic industries, they will pose challenges for U.S.-based pressure vessel and heat exchanger manufacturers by increasing operational costs and complicating supply chain logistics. However, the benefits can outweigh the drawbacks and will depend highly on how well domestic manufacturers adapt to increased material costs and whether demand shifts significantly in their favor. If manufacturers can efficiently manage costs and scale production, they could gain long-term advantages from the trade policies.
The administration has published this fact sheet (click here) on the White House website.
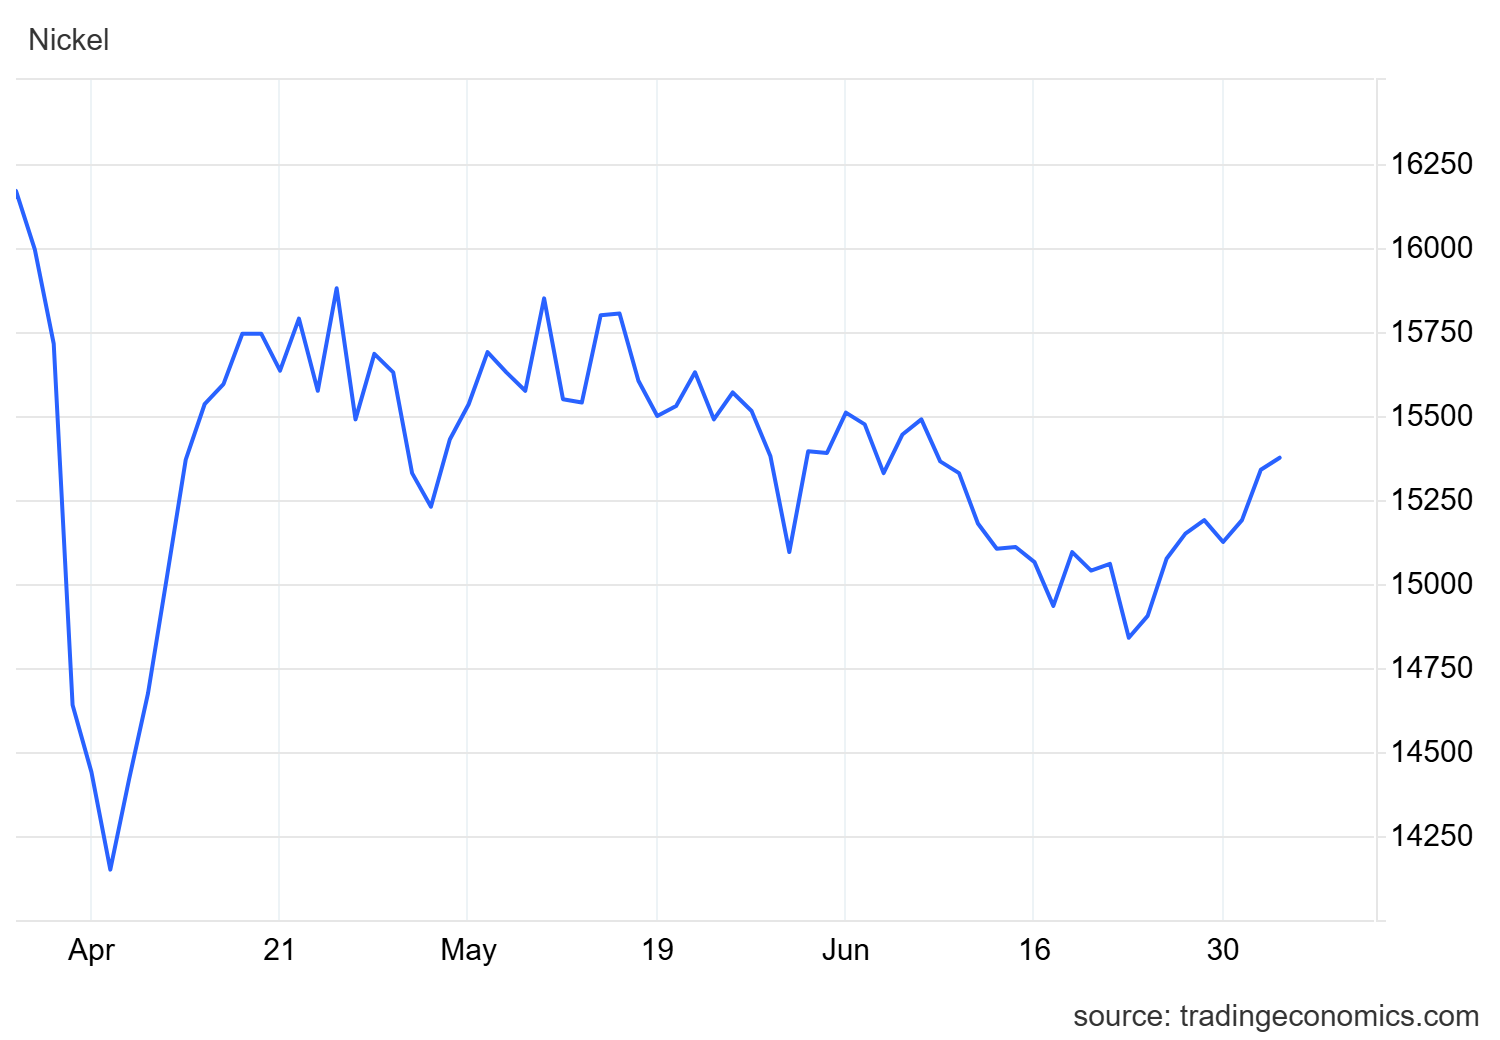
Nickel futures were at $6.895 per lb, rebounding from the over two-month low of $6.704 per lb touched on June 23rd as markets assessed the magnitude that output cuts from Indonesia will have on countering the current oversupply of metal in major exchanges. The Indonesian government reduced nickel mining quotas by 120 million tons to 150 million this year, cutting global supply by 35% from current levels. This was due the surge of Chinese smelting projects in Indonesia after the latter prohibited the export of nickel ores in 2020. Indonesia was the host of 44 nickel smelting operations as of September, compared with four a decade ago. Consistently, nickel warrants available at LME warehouses rose by 40,000 tons since the start of the year to 190,000 tons. In the meantime, lingering skepticism over whether the White House will refrain from reigniting aggressive tariffs against trading partners by the July 9th deadline also pressured base metals.
Nickel Pricing ($/lb):
June 2nd: 7.035 (enter, monthly high)
June 23rd: 6.731 (monthly low)
June 30th: 6.861 (exit)
Plate mill plate lead times (weeks):
Domestic:
Stainless: 4 to 8 (was 4 to 6)
Duplex: 4 to 8 (was 4 to 6)
Nickel Alloys: 7 to 10 (was 6 to 12)
Carbon steel: 9 to 12 (was 8 to 11)
*Keep in mind, some plates will exceed the estimated ranges depending on the mill’s production schedule and slab availability.*
Welded tubing lead times (weeks):
Domestic:
Carbon: 6 to 16 (no change)
Stainless: 8 to 12 (no change)
Nickel Alloy: 8 to 16 (no change)
Import:
Carbon: 14 to 25 (no change)
Stainless: 16 to 30 (no change)
Nickel Alloy: 16 to 42 (no change)
Seamless tubing lead times (weeks):
Domestic:
Carbon: 6 to 26 (no change)
Stainless: 8 to 26 (no change)
Nickel Alloy: 12 to 18 (no change)
*Lead times are accurate if hollows are in stock. If not, lead times can increase to 44 weeks as most hollows are of foreign melt.*
At Ward, our focus remains clear — delivering high-quality equipment and projects on time while providing an exceptional fabrication experience. We’re committed to transparency, collaboration, and smart solutions in the face of evolving market conditions. As always, we want to work through these challenges together, so let us know your thoughts. Please don’t hesitate to reach out if you have any questions about the current state of our industry’s material supply chain.
Below is the 90-day Nickel Price Trend (US$ per tonne).
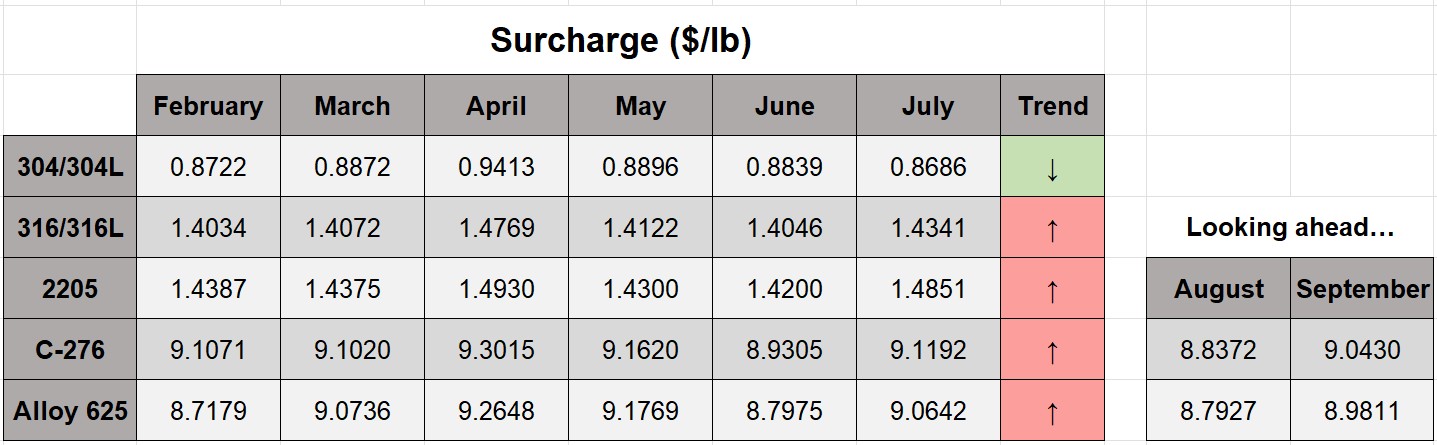
Here’s the current surcharge chart for 304/304LSS, 316/316LSS, 2205, C276, and 625.
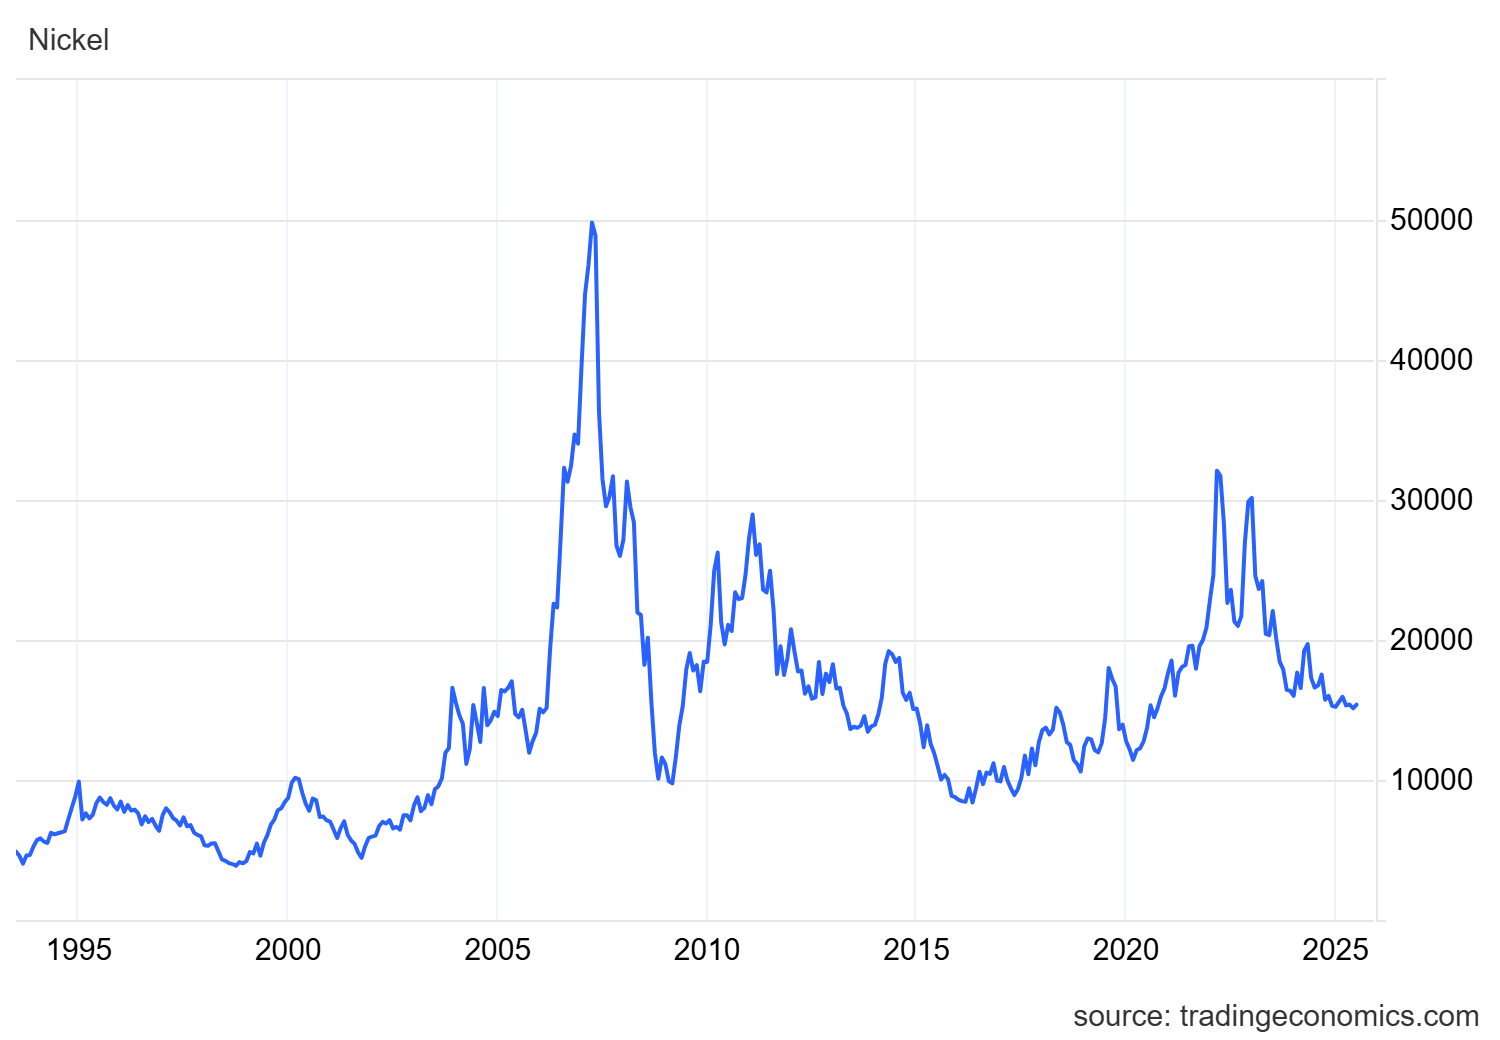
Nickel Prices have had an interesting ride over the past two decades with a low of $2.20/lb. in October of 2001 (following September 11 events) and a high of $23.72/lb. in May of 2007. Surcharges trail Nickel prices by approximately two months, so they would have been at their lowest in December of 2001 (304 was $0.0182/lb.) with the peak in July of 2007 (304 was $2.2839/lb.).
The chart below illustrates Nickel price by way of U.S. Dollars per Metric ton.
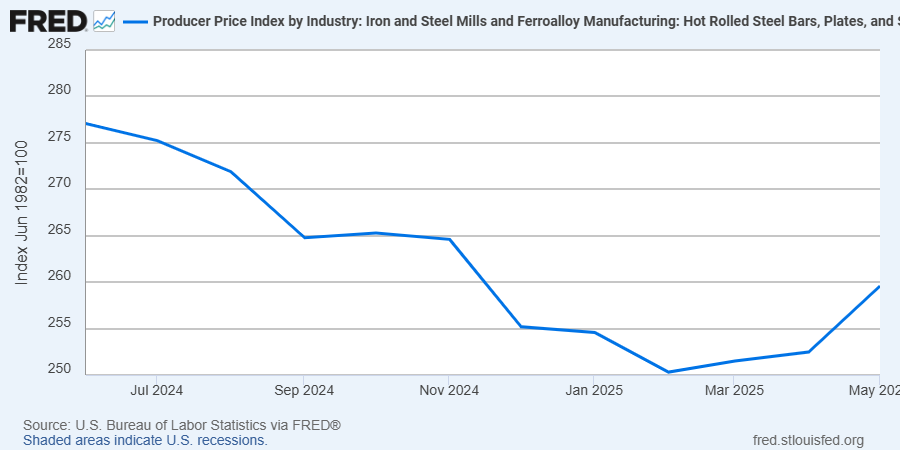
Here’s the Price Index for Hot Rolled Bars, Plate, and Structural Shapes.