The ISM Manufacturing PMI registered 48.7 percent in August, a 0.7 percentage point increase compared to the 48 percent recorded in July. The overall economy continued in expansion for the 64th month after one month of contraction in April 2020. (Important data point reference: A Manufacturing PMI reading above 50 percent indicates that the manufacturing economy is generally expanding; below 50 percent indicates that it is generally declining. A Manufacturing PMI above 42.5 percent, over a period of time, indicates that the overall economy, or gross domestic product (GDP), is generally expanding; below 42.5 percent, it is generally declining. The distance from 50 percent or 42.5 percent is indicative of the extent of the expansion or decline.
The Conference Board Consumer Confidence Index fell by 1.3 points in August to 97.4, down from 98.7 in July (revised up by 1.5 points).
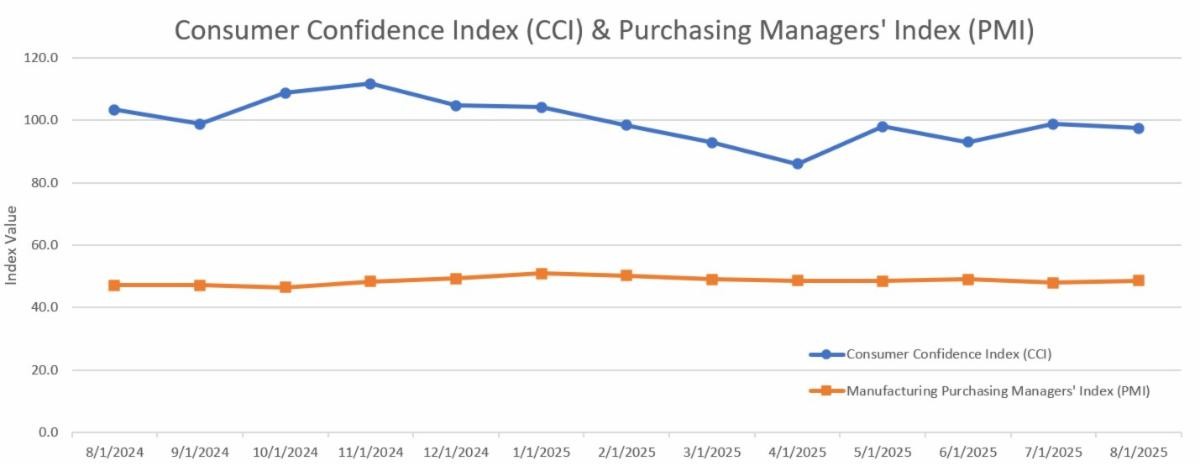
Other Notable Indexes:
New Orders: 51.4 (from 47.1)
Production: 47.8 (from 51.4)
Prices: 63.7 (from 64.8)
Backlog of Orders: 44.7 (from 46.8)
Employment: 43.8 (from 43.4)
Present Situation: 131.2 (from 131.5)
Expectations: 74.8 (from 74.4)
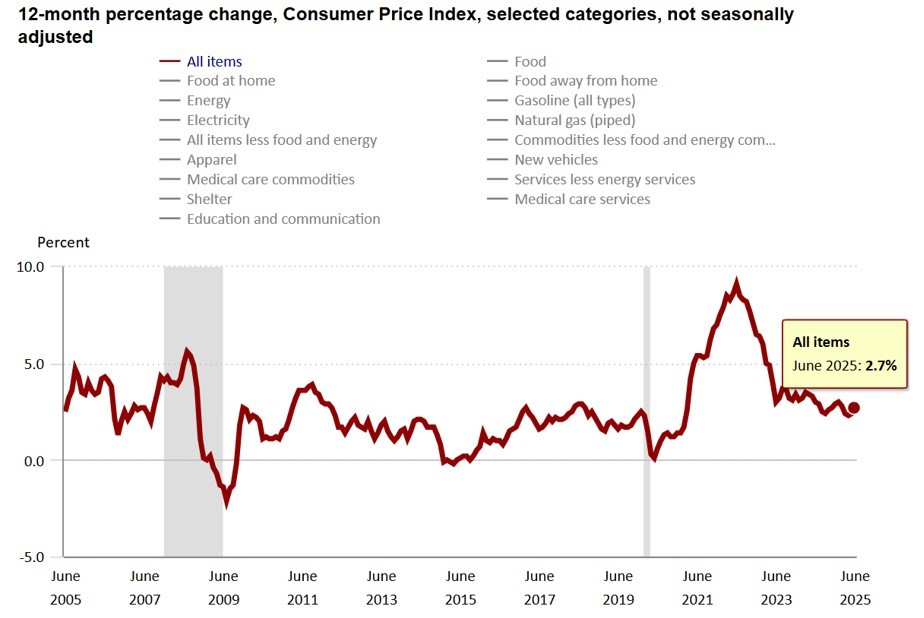
The Consumer Price Index (CPI, otherwise known as our “inflation” friend) is currently at 2.7% as of July 2025, no movement from 2.7% in June 2025. CPI tracks the rate of change in US inflation over time, and the following shows the trends over the past 20 years.
WTI Crude Oil futures fell below $62 per barrel on Friday, extending the sharp declines from the two prior sessions amid ample supply and uncertain demand. More reports suggested that OPEC+ will continue raising its oil production quotas ahead of this weekend’s meeting, with group leader Saudi Arabia setting the pace for the push. Such an output increase would coincide with an oil market that is already oversupplied amid high production from non-OPEC+ members and softening demand among the globe’s top fuel consumers, as the cartel aims to recover its market share following pandemic-period cuts and multiple nations in the group need to boost government budget revenues. Despite slowing manufacturing activity, tanker movements showed that Russian oil exports to China surged, taking up lost demand for India following the latter’s tariffs from the US. In the meantime, EIA data showed that oil stocks in the US unexpectedly rose by 2.4 million barrels in the last week of August.
WTI Crude Oil Pricing ($/Bbl):
August 1st: 67.33 (enter, monthly high)
August 19th: 61.77 (monthly low)
August 29th: 64.01 (exit)
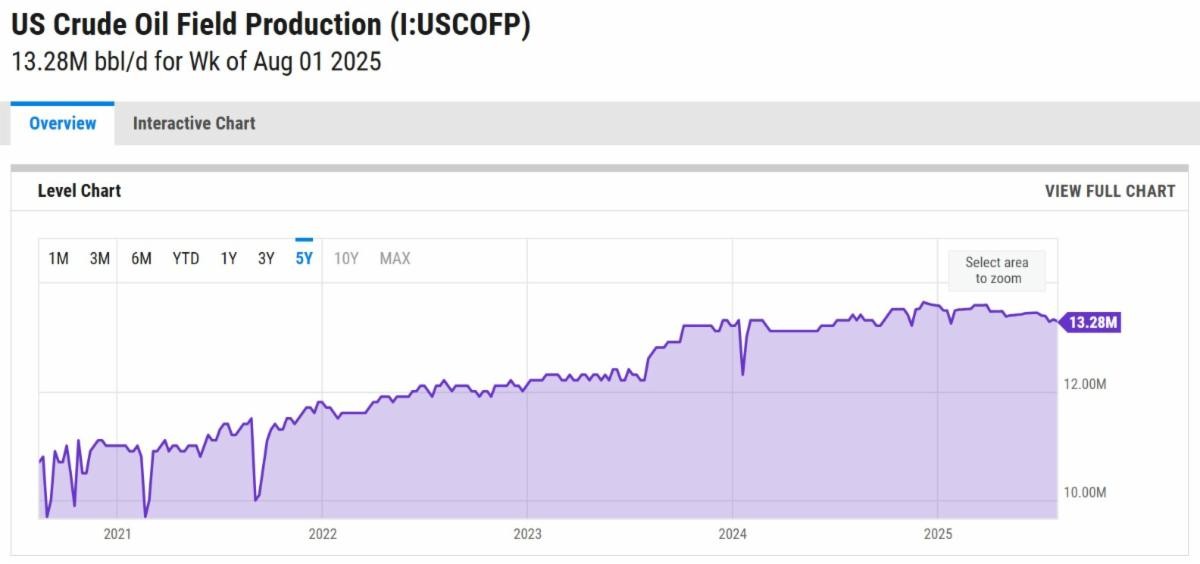
The online US Oil Rig Count is currently reported as 537, which is down 2 compared to last month’s report and down 45 from September 6, 2024. This key and leading indicator shows the current demand for products used in drilling, completing, producing, and processing hydrocarbons, which we all use every day as fuel sources and finished products.
The number of rigs conducting oil and gas drilling in the United States remains stagnant, but efficiency has increased significantly over the years, as shown in the chart below. We are drilling at or near record production levels. However, this trend of fewer rigs still reflects the priority of drillers to focus on efficiency and enhancing shareholder returns rather than expanding production through capital investments due to the previous administration’s desire to move away from fossil fuels. This philosophy might change now that the Trump administration is entirely behind fossil fuels. To provide context, in 2019, 954 rigs were drilling for oil and gas in the US, and, in 2014, there were 1609 rigs before oil prices dropped below $20 per barrel at the end of that year.
Tariffs have tightened, untightened, and will continue to evolve as the Trump administration navigates global negotiations.
Whew… there’s A LOT to unpack here, so hold on for the roller coaster ride.
A little background on where all of this started and what it means. Tariffs are duties placed on foreign goods, paid by domestic importers to Customs and Border Patrol at ports of entry. President Trump introduced tariffs on select Chinese goods in his first term, which President Joe Biden later maintained, along with duties on steel and aluminum from most countries. In February, Trump reinstated tariffs—10% more on Chinese imports, bringing them to 35%, and 25% on Mexican and Canadian goods (except for oil, taxed at 10%). However, these tariffs on Canada and Mexico were temporarily paused after both countries reaffirmed commitments to border security cooperation with the U.S.
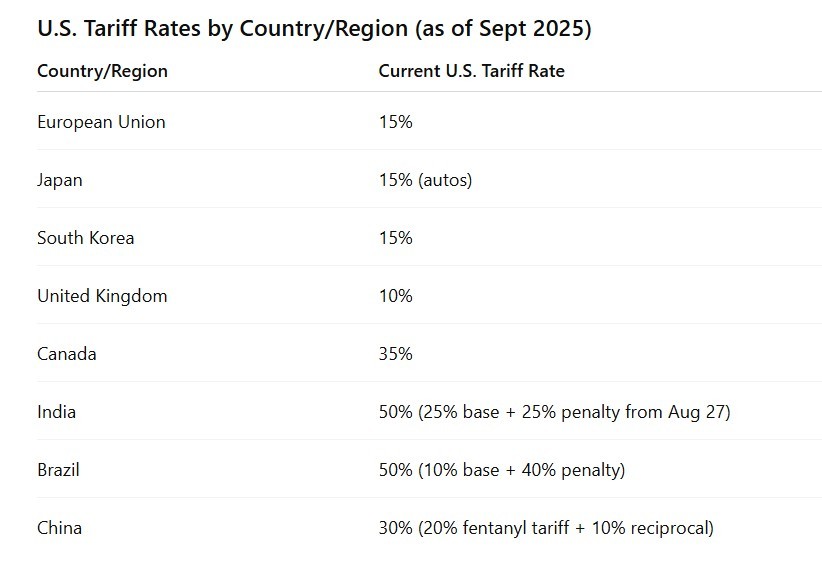
As of September 9th, 2025 at 10:45 am, we are looking at the following.
As of mid-August 2025, the U.S. has established some of the highest tariff levels in decades, with broad-based reciprocal tariffs in place, deep country-specific penalties for nations like India and Brazil, and a pivotal deadline looming for China. Domestic fallout is mounting—consumers and businesses face rising costs, legal challenges continue to swirl, and global trade tensions are escalating.
Key Developments since our August Newsletter
1 – Legal Status of Reciprocal Tariffs
- On August 29, 2025, the U.S. Court of Appeals for the Federal Circuit ruled that most of Trump’s “reciprocal tariffs” were illegal, citing improper use of presidential authority under IEEPA. However, these tariffs remain effective pending appeal, with enforcement paused only after mid-October as the administration seeks a Supreme Court review.
2 – De Minimis Exemption Terminated Early
- Originally planned for 2027, the de minimis exemption (duty-free import threshold under $800) was eliminated effective August 29, 2025 via executive order. Shipments now bear duties between 10% and 50% or flat fees of $80–$200.
- Global postal traffic into the U.S. dropped by 81%, as carriers like those from Germany, France, and Mexico halted shipments to the U.S. amid rapid adjustment and compliance disruptions.
3 – Strain on the U.S.–E.U. Trade Truce
- The trade agreement with the EU is under increasing pressure. The U.S. unexpectedly broadened 50% tariffs on metals to include hundreds of additional steel- and aluminum-containing products—well beyond previously agreed items—prompting resistance from European manufacturers and putting the pact at risk.
4 – Refined Reciprocal Tariff Procedures
On September 5, 2025, President Trump signed an executive order to modify the scope of reciprocal tariffs and establish new procedures for trade and security-based agreements—suggesting a more tailored, condition-based approach to exemptions.
While the tariffs may increase raw materials and components costs, they will also provide a much more competitive advantage for US-based pressure vessel and heat exchanger manufacturers. The government effectively makes imported products more expensive by imposing tariffs on foreign-made pressure vessels and heat exchangers. This could lead to several potential benefits for domestic manufacturers: reduced foreign competition, increased market share, encouragement for domestic investment, potential price stabilization in our market, and a boost in government and industrial contracts. Overall, it boosts the purchase of American-made products, which is good for American workers.
In summary, while the tariffs aim to help and protect domestic industries, they will pose challenges for US-based pressure vessel and heat exchanger manufacturers by increasing operational costs and complicating supply chain logistics. However, the benefits can outweigh the drawbacks and will depend highly on how well domestic manufacturers adapt to increased material costs and whether demand shifts significantly in their favor. If manufacturers can efficiently manage costs and scale production, they could gain long-term advantages from the trade policies.
The administration has published this fact sheet (click here) on the White House website.
Nickel futures rose to $7.008 per pound in September, the highest in one month, as output cutbacks momentarily eased the magnitude of oversupply from major producers. Nickel pig iron metal content output from Indonesia, the world’s top producer, fell by 1.7% from the previous month in July as suspensions in selected smelters were delayed from being resumed. Prices rebounded but remained in a tight range for the year, near their lowest since Indonesia blocked the export of ores in 2020. This drove the largest nickel consumers to establish refiners within Indonesia, and capacity soared, leading to supply surpluses. The Indonesian government reduced nickel mining quotas by 120 million tons to 150 million this year, cutting global supply by 35% from current levels. However, soft bidding prices throughout the year indicated that markets don’t see constraints dampening the oversupplied backdrop.
Nickel Pricing ($/lb):
August 1st: 6.813 (enter)
August 21st: 6.781 (monthly low)
August 29th: 6.988 (monthly high, exit)
Plate mill plate lead times (weeks):
Domestic:
Stainless: 6 to 7 (no change)
Duplex: 6 to 7 (no change)
Nickel Alloys: 6 to 11 (was 8 to 10)
Carbon steel: 6 to 8 (no change)
*Keep in mind, some plates will exceed the estimated ranges depending on the mill’s production schedule and slab availability.*
Welded tubing lead times (weeks):
Domestic:
Carbon: 6 to 16 (no change)
Stainless: 8 to 12 (no change)
Nickel Alloy: 8 to 16 (no change)
Import:
Carbon: 14 to 25 (no change)
Stainless: 16 to 30 (no change)
Nickel Alloy: 16 to 42 (no change)
Seamless tubing lead times (weeks):
Domestic:
Carbon: 6 to 26 (no change)
Stainless: 8 to 26 (no change)
Nickel Alloy: 12 to 18 (no change)
*Lead times are accurate if hollows are in stock. If not, lead times can increase to 44 weeks as most hollows are of foreign melt.*
At Ward, our focus remains clear — delivering high-quality equipment and projects on time while providing an exceptional fabrication experience. We’re committed to transparency, collaboration, and smart solutions in the face of evolving market conditions. As always, we want to work through these challenges together, so let us know your thoughts. Please don’t hesitate to reach out if you have any questions about the current state of our industry’s material supply chain.
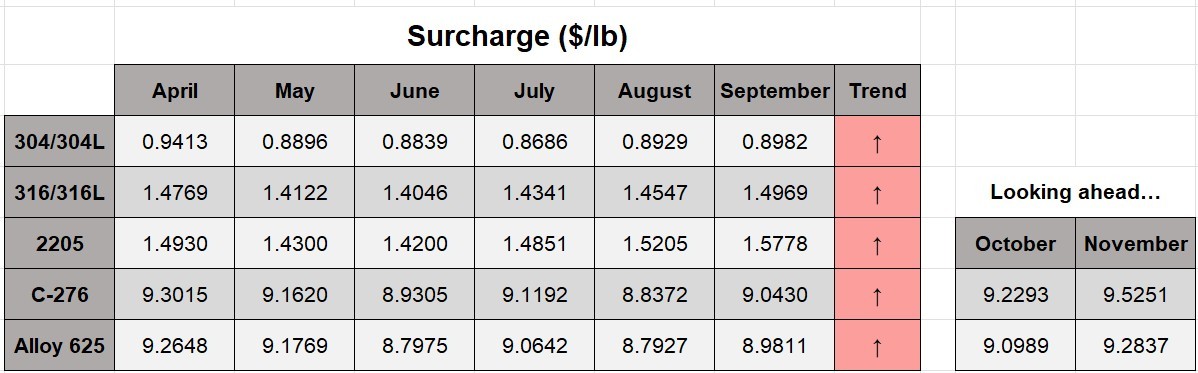
Here’s the current surcharge chart for 304/304LSS, 316/316LSS, 2205, C276, and 625.
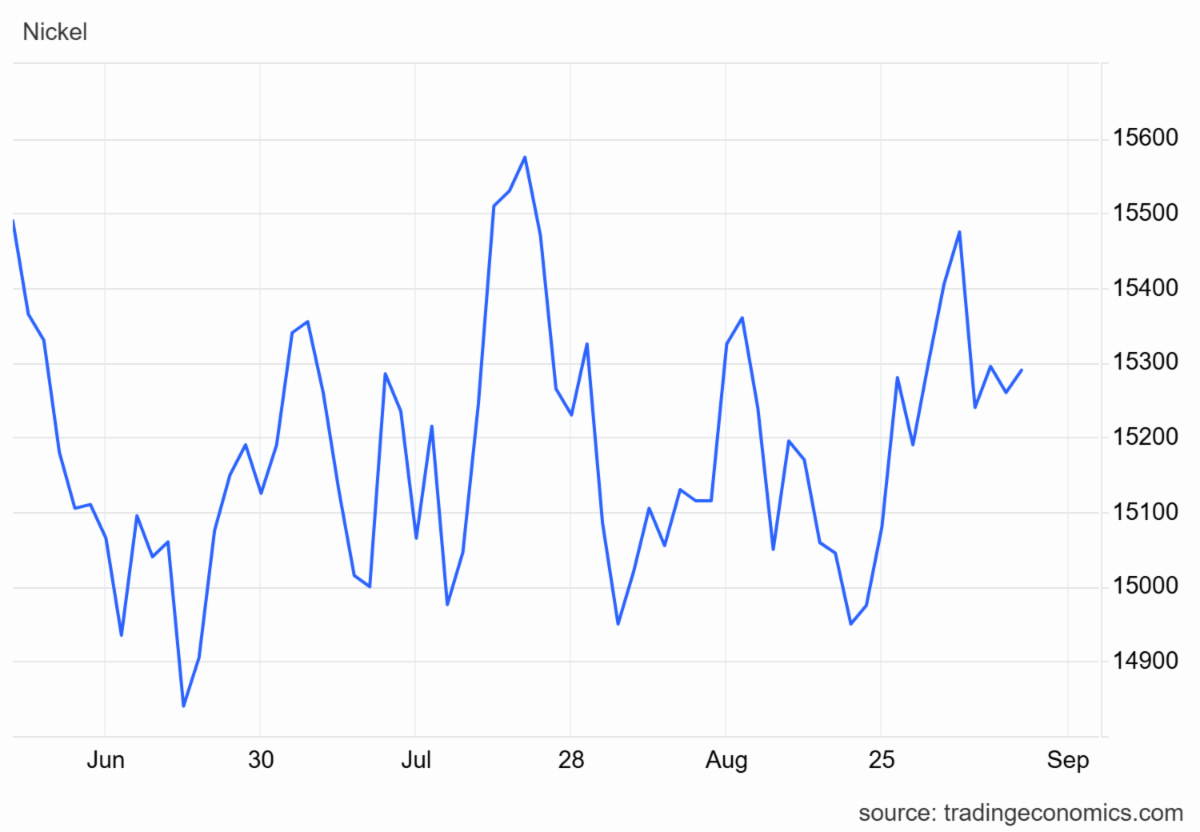
Below is the 90-day Nickel Price Trend (US$ per tonne).
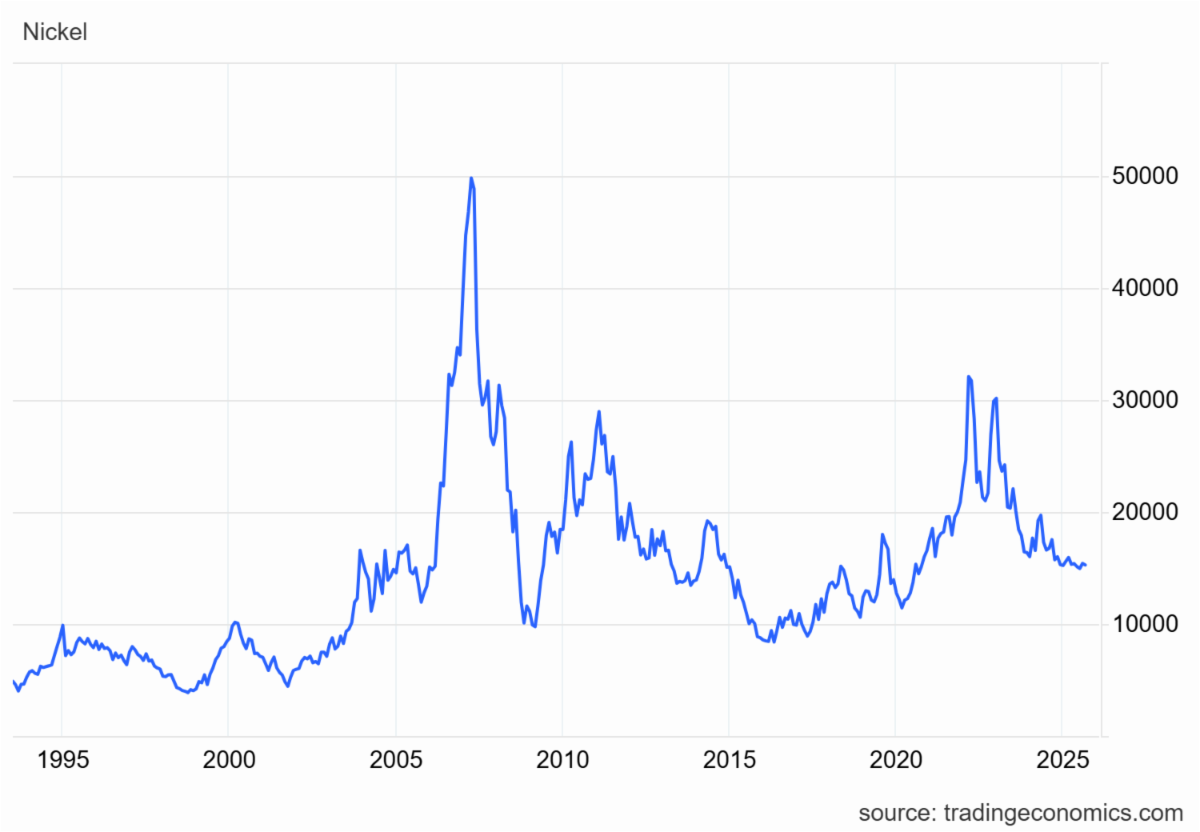
Nickel Prices have had an interesting ride over the past three decades, with a low of $2.20/lb. in October 2001 (following the September 11 events) and a high of $23.72/lb. in May 2007. Surcharges trail Nickel prices by approximately two months, so they would have been at their lowest in December 2001 (304 was $0.0182/lb.) and peak in July 2007 (304 was $2.2839/lb.).
The chart below illustrates Nickel price by way of U.S. Dollars per Metric ton.
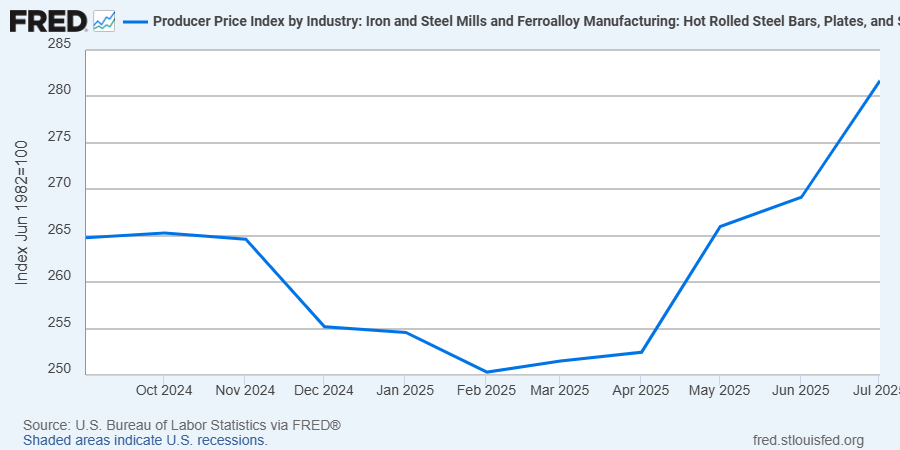
Here’s the Price Index for Hot Rolled Bars, Plate, and Structural Shapes.