Economic activity in the manufacturing sector contracted in December for the 10th consecutive month, following a two-month expansion preceded by 26 straight months of contraction, say the nation’s supply executives in the latest ISM® Manufacturing PMI® Report.
The Manufacturing PMI® registered 47.9 percent in December, a 0.3-percentage point decrease compared to the reading of 48.2 percent in November and the lowest reading of 2025. The overall economy, as in GDP (Gross Domestic Product), continued in expansion for the 68th month after one month of contraction in April 2020. (Important data point reference: A Manufacturing PMI reading above 50 percent indicates that the manufacturing economy is generally expanding; below 50 percent indicates that it is generally declining. A Manufacturing PMI above 42.5 percent, over a period of time, indicates that the overall economy, or gross domestic product (GDP), is generally expanding; below 42.5 percent, it is generally declining. The distance from 50 percent or 42.5 percent is indicative of the extent of the expansion or decline.)
The Conference Board Consumer Confidence Index® declined by 3.8 points in December to 89.1 (1985=100), from 92.9 in November. This includes an upward revision to November’s reading, as responses collected after the end of the federal government shutdown (which spanned October 1 to November 12) were more positive than those collected during the impasse.
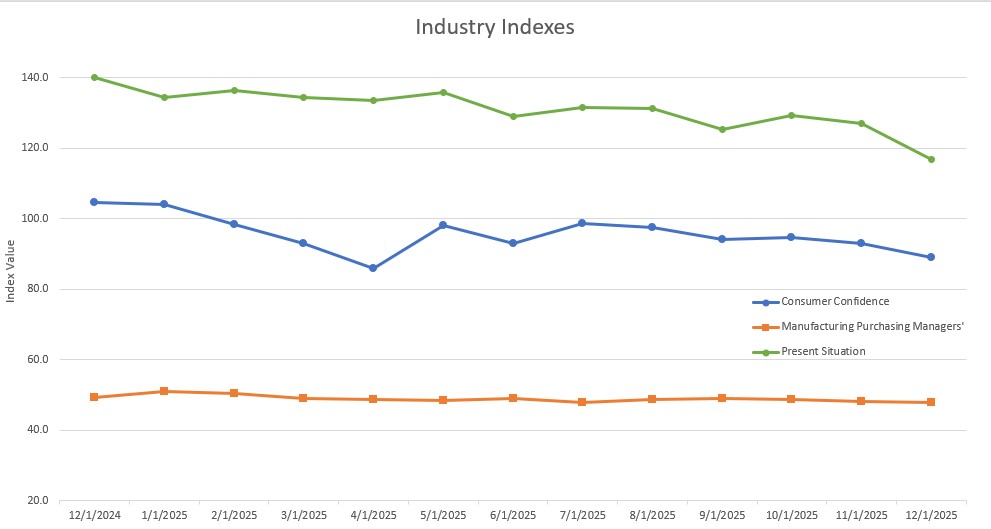
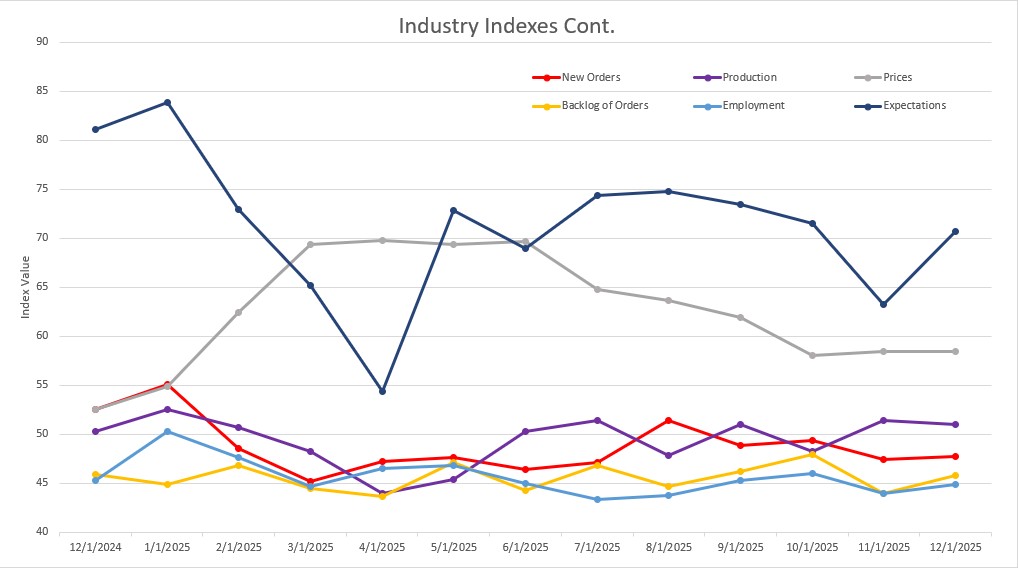
Please see the graphs for other notable indexes related to our industry.
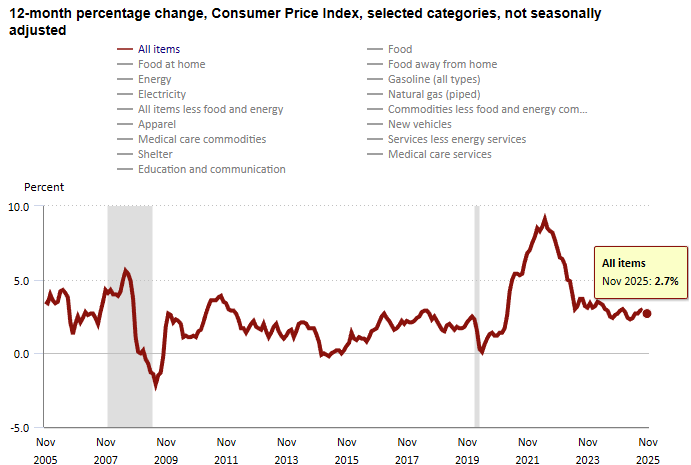
The Consumer Price Index (CPI, otherwise known as our “inflation” friend) is currently at 2.7% as of November 2025, down from 3.0% in September/October 2025. CPI tracks the rate of change in US inflation over time, and the following shows the trends over the past 20 years.
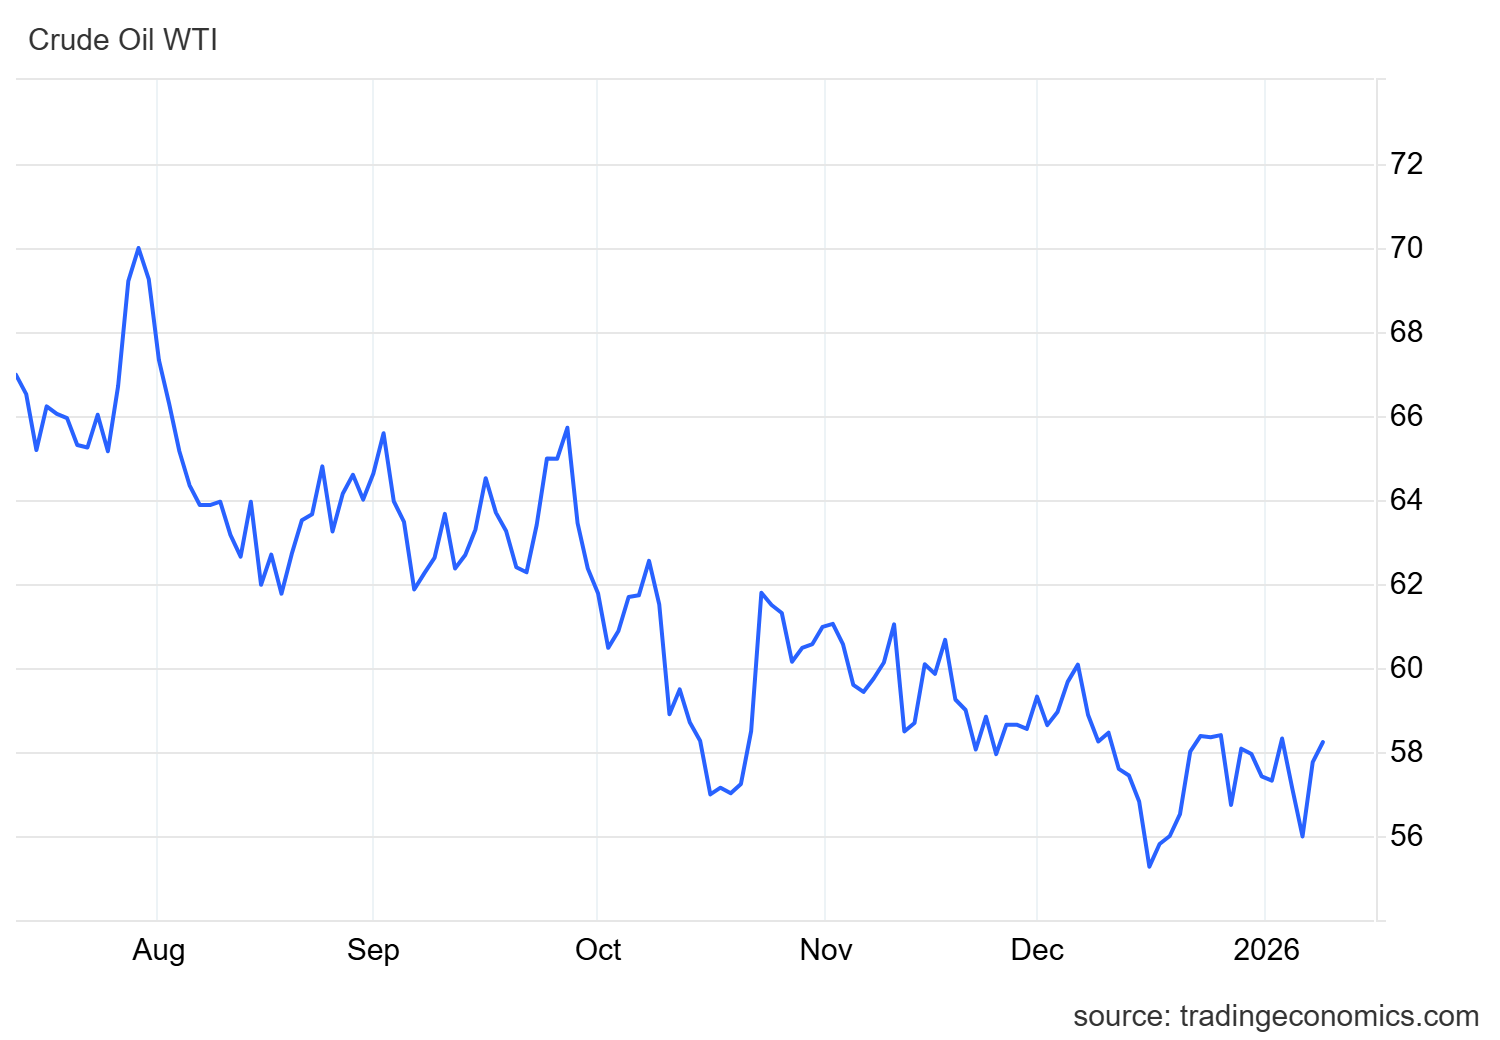
WTI Crude Oil futures rose to around $58.3 per barrel on Friday, building on a more than 3% gain in the previous session, the largest since last October, as markets continued to weigh geopolitical risks. President Donald Trump warned Iran of a “hard” response if its government caused protesters to lose their lives, reigniting concerns over potential supply disruptions from one of OPEC’s largest producers. Traders also digested news that Senator Lindsey Graham said Trump approved a bipartisan Russia sanctions bill targeting countries buying discounted Russian oil that funds Moscow’s war. Meanwhile, US actions in Venezuela remained in focus after Washington seized two oil tankers linked to the country in the Atlantic, including one flying a Russian flag, highlighting Trump’s intensified efforts to control energy flows in the Americas and pressure Venezuela’s socialist government. For the week, oil is on track for a third consecutive advance.
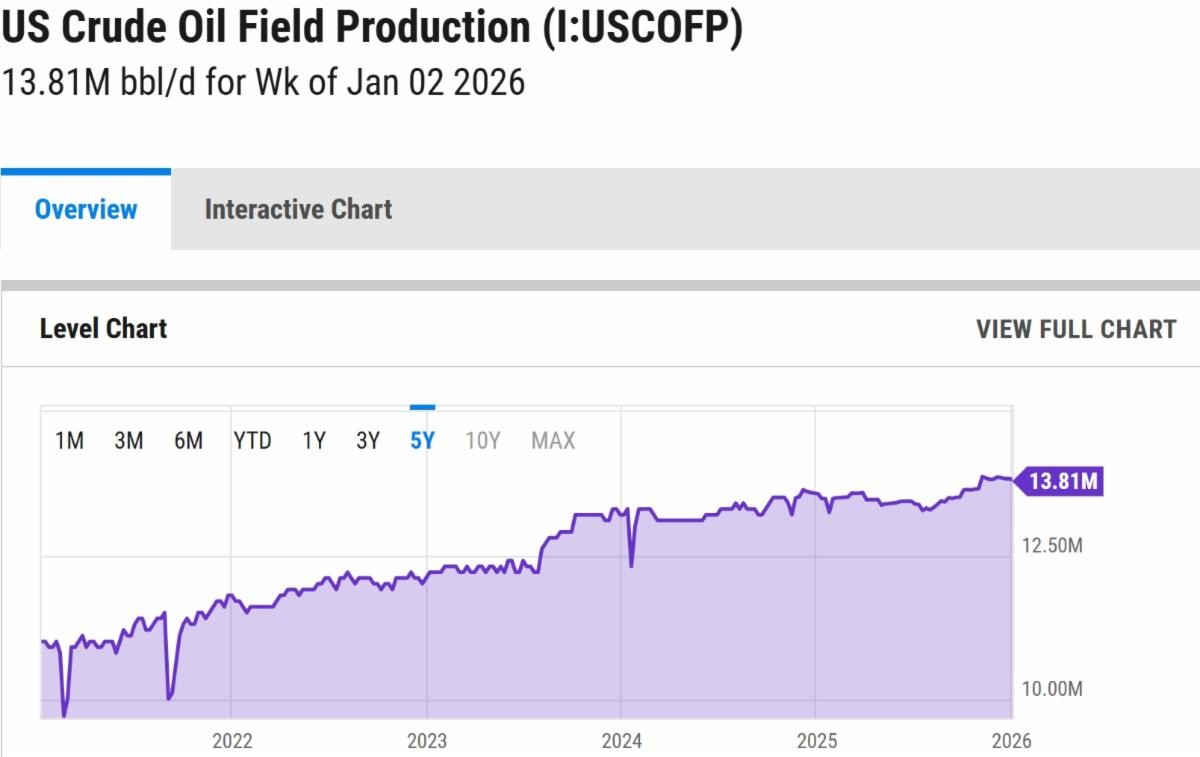
The online US Oil Rig Count is currently reported as 544, which is down 5 compared to last month’s report and up 40 from January 10, 2025. This key and leading indicator shows the current demand for products used in drilling, completing, producing, and processing hydrocarbons, which we all use every day as fuel sources and finished products.
The number of rigs conducting oil and gas drilling in the United States remains stagnant, but efficiency has increased significantly over the years, as shown in the chart below. We are drilling at or near record production levels. However, this trend of fewer rigs still reflects the priority of drillers to focus on efficiency and enhancing shareholder returns rather than expanding production through capital investments due to the previous administration’s desire to move away from fossil fuels. This philosophy might change now that the Trump administration is entirely behind fossil fuels. To provide context, in 2019, 954 rigs were drilling for oil and gas in the US, and, in 2014, there were 1609 rigs before oil prices dropped below $20 per barrel at the end of that year.
Tariffs have tightened, untightened, and will continue to evolve as the Trump administration navigates global negotiations.
Whew… There’s A LOT to unpack here, so hold on for the roller coaster ride.
A little background on where all of this started and what it means. Tariffs are duties placed on foreign goods, paid by domestic importers to Customs and Border Patrol at ports of entry. President Trump introduced tariffs on select Chinese goods in his first term, which President Joe Biden later maintained, along with duties on steel and aluminum from most countries. In February, Trump reinstated tariffs—10% more on Chinese imports, bringing them to 35%, and 25% on Mexican and Canadian goods (except for oil, taxed at 10%). However, these tariffs on Canada and Mexico were temporarily paused after both countries reaffirmed commitments to border security cooperation with the U.S.
As of January 13, 2026, at 12 pm EST, U.S. tariff policy is still in flux but trending tighter across broad categories, with several fast-moving legal and policy shifts.
There hasn’t been a lot of change over the past month and this is where things stand right now…
Reciprocal tariffs face legal trouble. On Aug. 29, 2025, the U.S. Court of Appeals for the Federal Circuit held that most of the Trump Administration’s “reciprocal tariffs” exceeded presidential authority under IEEPA. The administration seeks Supreme Court review; portions remain in effect pending further proceedings and agency guidance. Here is the timeline of this important ruling.
JUL / AUG 2025 – Circuit split & cert granted
The appellate courts issue conflicting rulings on whether IEEPA authorizes reciprocal tariffs. The Supreme Court agrees to hear the case on an expedited schedule.
OCTOBER 2025 – Briefing completed
Business groups argue the tariffs are unauthorized and exceed presidential power. The Administration responds that IEEPA’s emergency authority allows tariff actions.
NOVEMBER 5, 2025 – Oral arguments
Justices express skepticism about using an “emergency” statute for a sweeping tariff program. Several question whether tariffs are effectively taxes requiring explicit congressional approval.
DECEMBER 2025 – Follow-on litigation begins
Companies begin filing protective lawsuits to preserve refund rights in case the Court ultimately overturns the tariffs.
FEB / JUN 2026 – Expected ruling
Possible outcomes:
- Court overturns the tariffs (most expected). Importers may receive refunds; IEEPA cannot be used to impose reciprocal tariffs.
- Court upholds the tariffs (less likely). Sweeping tariff authority under IEEPA remains intact.
- Middle position. Tariffs allowed only in a narrowly limited form; future use constrained.
De minimis is still suspended and gone for now. The long-standing duty-free threshold for shipments under $800 was terminated on Aug. 29, 2025 by executive action. International small-parcel flows fell by ~80% immediately after, as posts and carriers scrambled to comply; duties/fees now apply to those packages.
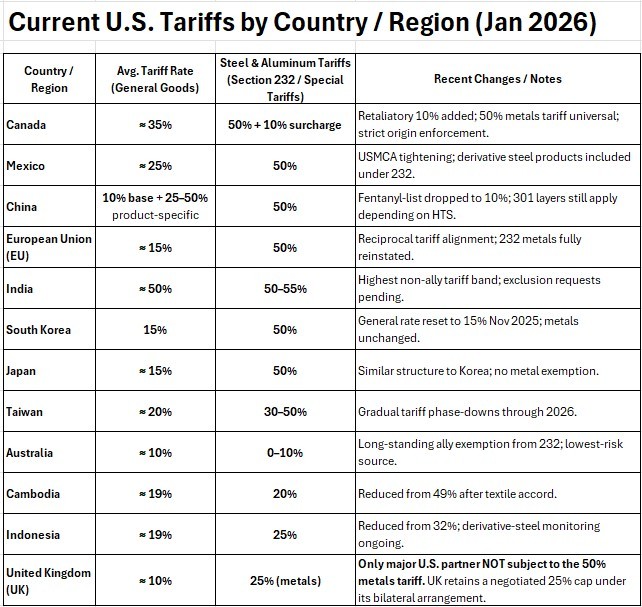
Metal tariffs widened and deepened. Section 232 steel/aluminum tariffs (now 50% in most cases) were expanded to cover hundreds of additional steel- and aluminum-containing products, straining the U.S.–EU truce and imposing additional burdens on origin tracing for importers.
The Trump administration and the People’s Republic of China agreed on a trade and economic deal. The U.S. will lower tariffs on certain Chinese-imports tied to the fentanyl supply chain from ~ 20 % to ~ 10 %, effective November 10.
The U.S. will suspend, for one year starting Nov 10, 2025, the responsive actions under Section 301 of the U.S.–China maritime, logistics & ship-building investigation.
The universal “reciprocal” tariff (applied broadly) remains at 10 % and will remain so until at least November 10, 2026, under the deal with China.
Canada/Mexico dynamics. Earlier in the year, planned across-the-board tariffs on Canada and Mexico were paused after border-security commitments; subsequent months saw rolling adjustments and compliance-based carve-outs under USMCA rules.
Canada has an additional 10% surcharge now after a recent TV ad dispute.
What does this mean for U.S. pressure vessel and heat exchanger manufacturers?
Price pressure on inputs – Expanded metals coverage and higher headline rates raise costs for imported plate, tube, fittings, and subassemblies, especially where origin tracing is complex.
Competitive tailwind on finished goods – Higher landed costs on foreign vessels and exchangers reduce price undercutting in bids, supporting U.S. share in industrial and government contracts (Inference from current tariff structure and coverage).
Procurement and compliance load – With de minimis gone and derivative-product rules widening, expect more broker work, HTS reclassifications, certificates of origin, and tighter vendor audits, particularly on mixed-origin fabrications.
Volatility risk – The legal overhang on reciprocal tariffs plus ongoing executive adjustments means terms can change quickly; quote validity windows and escalation clauses matter more now.
Bottom line – Tariffs currently favor domestic manufacturers of finished equipment by lifting competitors’ U.S. price floors, but they also raise input and compliance costs. Shops that lock in domestic steel where feasible, tighten origin documentation, and build flexible pricing into quotes are best positioned to capture the demand shift while managing volatility.
How does this affect your pressure vessel and heat exchanger pricing?
At Ward, we purchase 80-90% domestically depending upon the project and do not purchase any materials from China. This means that our total material spend has seen a rough 5-15% increase since the tariffs were enacted, resulting in a 3-10% overall unit price increase after labor is factored in. We are doing our part to support American manufacturing while keeping our pricing as competitive as possible.
The administration has published several tariff fact sheets on the White House website (click here) as the tariff topic has evolved.
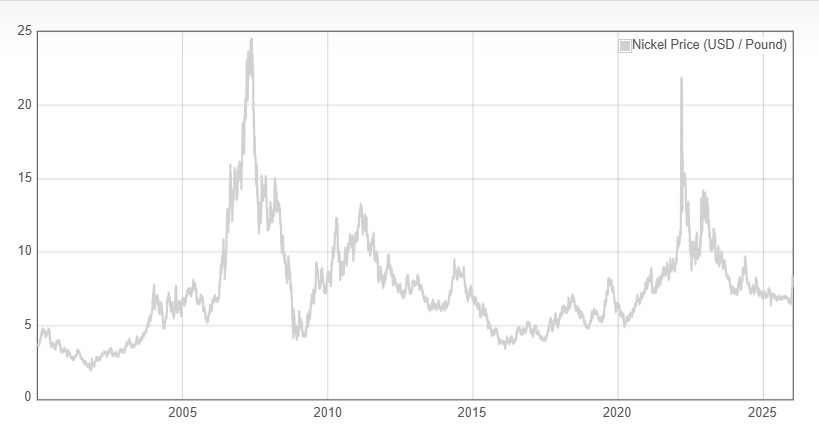
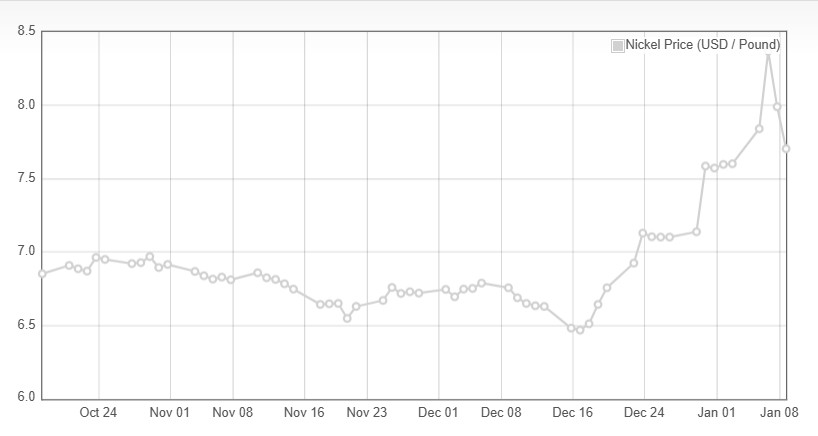
Nickel futures slumped to $7.756 per pound from the over-two-year high of $8.562 per pound touched on January 6th as markets reconsidered the magnitude of output cuts by top producer Indonesia. Jakarta had proposed a 34% reduction in nickel output in its 2026 budget to tackle growing concerns of oversupply and warnings from miners that ore grades are deteriorating. However, the government refrained from providing details on mining quotas on their latest briefing, limiting the confidence over earlier pledges. Despite the public efforts to limit output, prolonged surpluses drove benchmark futures to underperform other base metals, with Russia’s Nornickel raised its surplus forecasts for next year to 275,000 tonnes despite Indonesia’s signals of lower output. Also, stockpiles at the LME rose by over 93,000 tonnes to 255,000 last year. On the demand front, muted purchasing levels of stainless steel globally were offset by the higher usage of nickel in electric vehicles.
Plate mill plate lead times (weeks):
Domestic:
Stainless & Duplex: 5 to 7 (previously 4 to 7)
Nickel Alloys: 6 to 11 (no change)
Carbon steel: 6 to 8 (previously 4 to 6)
*Keep in mind, some plates will exceed the estimated ranges depending on the mill’s production schedule and slab availability.*
Welded tubing lead times (weeks):
Domestic:
Carbon: 6 to 16 (no change)
Stainless: 8 to 15 (no change)
Nickel Alloy: 8 to 18 (no change)
Import:
Carbon: 14 to 25 (no change)
Stainless: 16 to 30 (no change)
Nickel Alloy: 16 to 42 (no change)
Seamless tubing lead times (weeks):
Domestic:
Carbon: 6 to 26 (no change)
Stainless: 8 to 26 (no change)
Nickel Alloy: 8 to 18 (no change)
*Lead times are accurate if hollows are in stock. If not, lead times can increase to 44 weeks as most hollows are of foreign melt. *
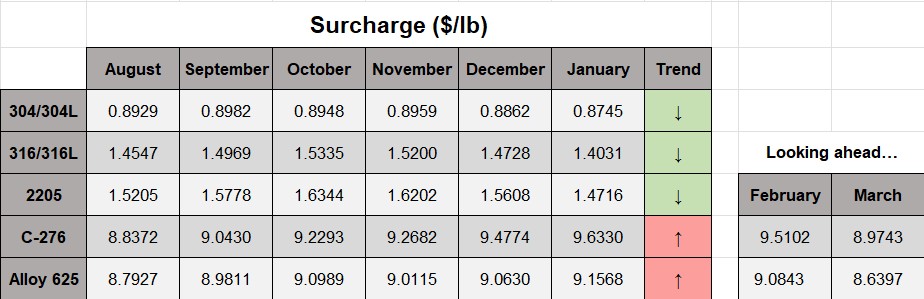
Nickel Prices have had an interesting ride over the past three decades, with a low of $2.20/lb. in October 2001 (following the September 11 events) and a high of $23.72/lb. in May 2007. Surcharges trail Nickel prices by approximately two months, so they would have been at their lowest in December 2001 (304 was $0.0182/lb.) and peak in July 2007 (304 was $2.2839/lb.).