The ISM Manufacturing PMI registered 50.3 percent in February, 0.6 percentage point lower compared to the 50.9 percent recorded in January. The overall economy continued in expansion for the 58th month after one month of contraction in April 2020. (Important data point reference: A Manufacturing PMI reading above 50 percent indicates that the manufacturing economy is generally expanding; below 50 percent indicates that it is generally declining. A Manufacturing PMI above 42.5 percent, over a period of time, indicates that the overall economy, or gross domestic product (GDP), is generally expanding; below 42.5 percent, it is generally declining. The distance from 50 percent or 42.5 percent is indicative of the extent of the expansion or decline.)
The Conference Board Consumer Confidence Index declined by 5.8 points in February to 98.3 (1985=100).
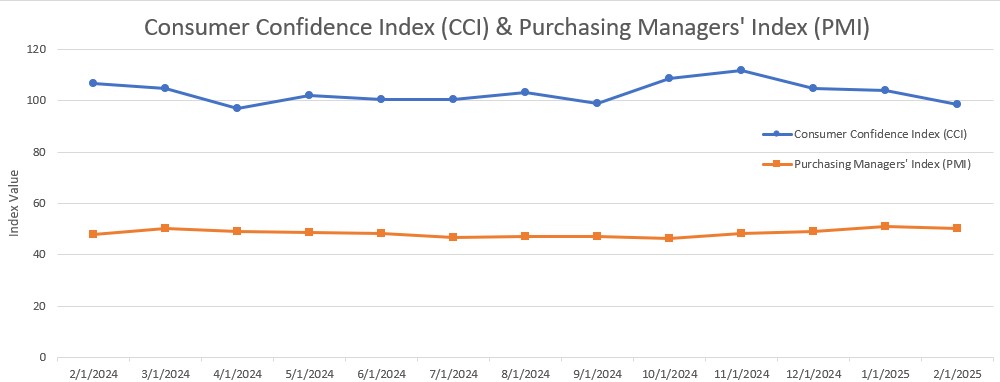
Other Notable Indexes:
New Orders: 48.6 (from 55.1)
Production: 50.7 (from 52.5)
Prices: 62.4 (from 54.9)
Backlog of Orders: 46.8 (from 44.9)
Employment: 47.6 (from 50.3)
Expectations: 72.9 (from 82.2)
Present Situation: 136.5 (from 139.9)
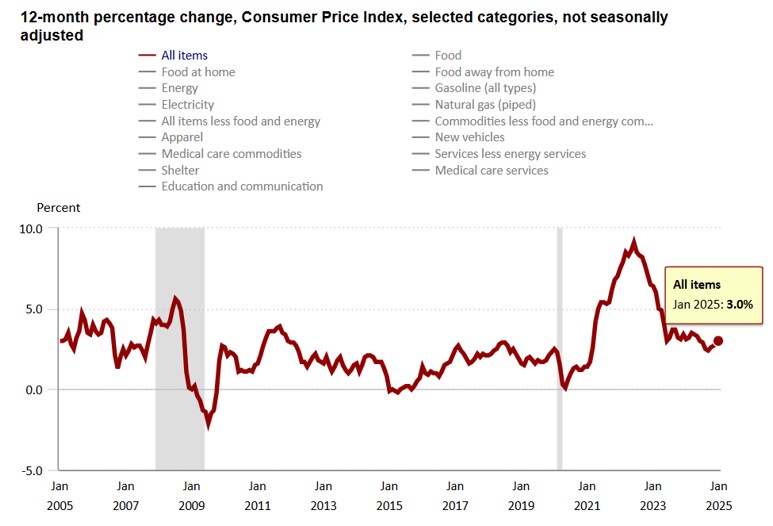
The Consumer Price Index (CPI, otherwise known as our “inflation” friend) is currently at 3.0% as of January 2025, up from 2.9% in December 2024. CPI tracks the rate of change in US inflation over time and the following shows the trends over the past 20 years.
WTI Crude Oil faced pressure from ongoing trade tensions, with the U.S. imposing tariffs on Canadian and Mexican goods, including energy imports, while OPEC+ plans to raise output. Additionally, the U.S. is considering exempting automakers from the 25% tariff, with reports suggesting President Trump may eliminate the 10% tariff on Canadian energy imports like crude and gasoline. OPEC+, which includes Russia, agreed on Monday to increase production for the first time since 2022. Furthermore, U.S. crude inventories rose more than expected, driven by seasonal refinery maintenance, while gasoline and distillate stocks declined due to increased exports, according to the Energy Information Administration.
WTI Crude Oil Pricing ($/Bbl):
Feb. 3rd: 73.16
Feb. 11th: 73.32 (monthly high)
Feb. 26th: 68.62 (monthly low)
Feb. 28th: 69.78
The online US Oil Rig Count is currently reported as 593 which is ??7 compared to last month’s report and ??36 from March 1 of 2024. This key and leading indicator shows the current demand for products used in drilling, completing, producing, and processing hydrocarbons which all of us use every day as fuel sources and finished products.
The number of rigs conducting oil and gas drilling in the United States continues to remain stagnant but efficiency has increased a lot over the years, as you can see from the chart below. We are now drilling at record production levels. This trend of fewer rigs however still reflects the priority of drillers to focus on efficiency and enhancing shareholder returns rather than expanding production through capital investments due to the previous administration’s desire to move away from fossil fuels. This philosophy might be changing now that the Trump administration is fully behind fossil fuels. To provide context, in 2019, 954 rigs were drilling for oil and gas in the US, and, in 2014, there were 1609 rigs before oil prices dropped below $20 per barrel at the end of that year.
However, solid oil prices will likely prevent the rig count from decreasing significantly, possibly leading to a rebound in 2025 with a new more oil-friendly administration in office (Drill, baby, drill!). Currently, the West Texas Intermediate benchmark prices have been at or around $75 per barrel, sufficient for most drillers to be profitable.

Tariffs have tightened and will continue to evolve as the Trump administration reopens global negotiations after taking office. There’s A LOT to unpack here so hold on for the ride.
Just after midnight on Tuesday, March 4th, President Donald Trump imposed 25% tariffs on all Mexican and Canadian imports, with a lower 10% tariff on Canadian energy. He also doubled existing tariffs on Chinese products to 20%, on top of the old 25% tariff. In response, China imposed up to 15% tariffs on some U.S. imports, while Canada introduced a 25% levy. Mexican President Claudia Sheinbaum announced that Mexico would impose tariffs on U.S. goods by Sunday but did not provide details.
On Thursday, March 6th, President Trump announced a pause on tariffs for all Mexican and Canadian imports covered under the United States–Mexico–Canada Agreement (USMCA) until April 2.
A little background to where we started. Tariffs are duties placed on foreign goods, paid by domestic importers to Customs and Border Patrol at ports of entry. President Trump introduced tariffs on select Chinese goods in his first term, which President Joe Biden later maintained, along with duties on steel and aluminum from most countries. In February, Trump reinstated tariffs—10% more on Chinese imports, bringing them to 35%, and 25% on Mexican and Canadian goods (except for oil, taxed at 10%). However, these tariffs on Canada and Mexico were temporarily paused after both countries reaffirmed commitments to border security cooperation with the U.S.
President Trump defended the new tariffs as a measure to correct the trade deficit and curb fentanyl trafficking from China, Canada, and Mexico. “It may take some adjusting,” he told Congress on Tuesday, “but trust me, this will be even better.”
China’s embassy responded on X: “If war is what the U.S. wants—whether a tariff war, a trade war, or any other war—we’re ready to fight till the end.” Canadian Prime Minister Justin Trudeau criticized the move as “a very dumb thing to do,” warning it could disrupt a successful trade relationship.
Commerce Secretary Howard Lutnick said the administration is in talks with Canada and Mexico and is open to compromise. Following discussions with Ford, General Motors, and Stellantis on Wednesday, Trump granted a one-month tariff exemption for automakers. Agriculture Secretary Brooke Rollings also hinted at possible exemptions for the farming sector.
The tariff decision comes amid mixed economic signals. Jobless claims spiked to 242,000 two weeks ago, and pending home sales fell 4.6%—their lowest since records began in 2001. However, fourth-quarter GDP growth and January’s year-over-year inflation aligned with economists’ expectations.
Markets initially reacted negatively, with Canada’s main stock index dropping 1.7%, the S&P 500 falling 1.2%, and the Dow Jones slipping 1.6%. However, the automaker exemption helped stocks recover much of their losses..
For U.S.-based manufacturers of pressure vessels and heat exchangers, the impact of these tariffs will be interesting to see unfold and could be significant. Many of these manufacturers rely on imported raw materials and components. The imposed tariffs will lead to higher costs for these imports, potentially disrupting supply chains and increasing production expenses. Manufacturers will need to properly evaluate their supplier base to ensure they stay as competitive as possible.
While the tariffs may increase raw materials and components costs, they will also provide a much more competitive advantage for U.S.-based pressure vessel and heat exchanger manufacturers. The government effectively makes imported products more expensive by imposing tariffs on foreign-made pressure vessels and heat exchangers. This could lead to several potential benefits for domestic manufacturers: reduced foreign competition, increased market share, encouragement for domestic investment, potential price stabilization in our market, and a boost in government and industrial contracts. Overall, it boosts the purchase of American-made products, which is good for American workers.
In summary, while the tariffs aim to help and protect domestic industries, they will pose challenges for U.S.-based pressure vessel and heat exchanger manufacturers by increasing operational costs and complicating supply chain logistics. However, the benefits can outweigh the drawbacks and will depend highly on how well domestic manufacturers adapt to increased material costs and whether demand shifts significantly in their favor. If manufacturers can efficiently manage costs and scale production, they could gain long-term advantages from the trade policies.
Nickel has been trading in a tight range since the second half of February and remaining relatively close to the four-year low of $6.804/lb. Repeatedly tested in the last two months as markets assessed whether output cuts by Indonesia may be enough to counter an oversupplied market. Jakarta is considering reducing nickel mining quotas by 120 million tons in 2025, enough to reduce global supply by 35%. Still, the muted magnitude of the rebound indicated that markets expect nickel to remain oversupplied as stocks at LME warehouses remained more than double from one year ago at nearly 200 thousand tons. This is due to the surge of Chinese smelting projects in Indonesia after the latter prohibited the export of nickel ores in 2020. Indonesia was the host of 44 nickel smelting operations as of September, compared with four 10 years prior. In the meantime, manufacturing demand measured by both Chinese PMIs rose in February, limiting the bearish pressure.
Nickel Pricing ($/lb):
Feb. 3rd: 6.859 (monthly low)
Feb. 6th: 7.201
Jan. 17th: 7.294 (monthly high)
Jan. 31st: 7.072
Below is the 90 day Nickel Price Trend (US$ per tonne).
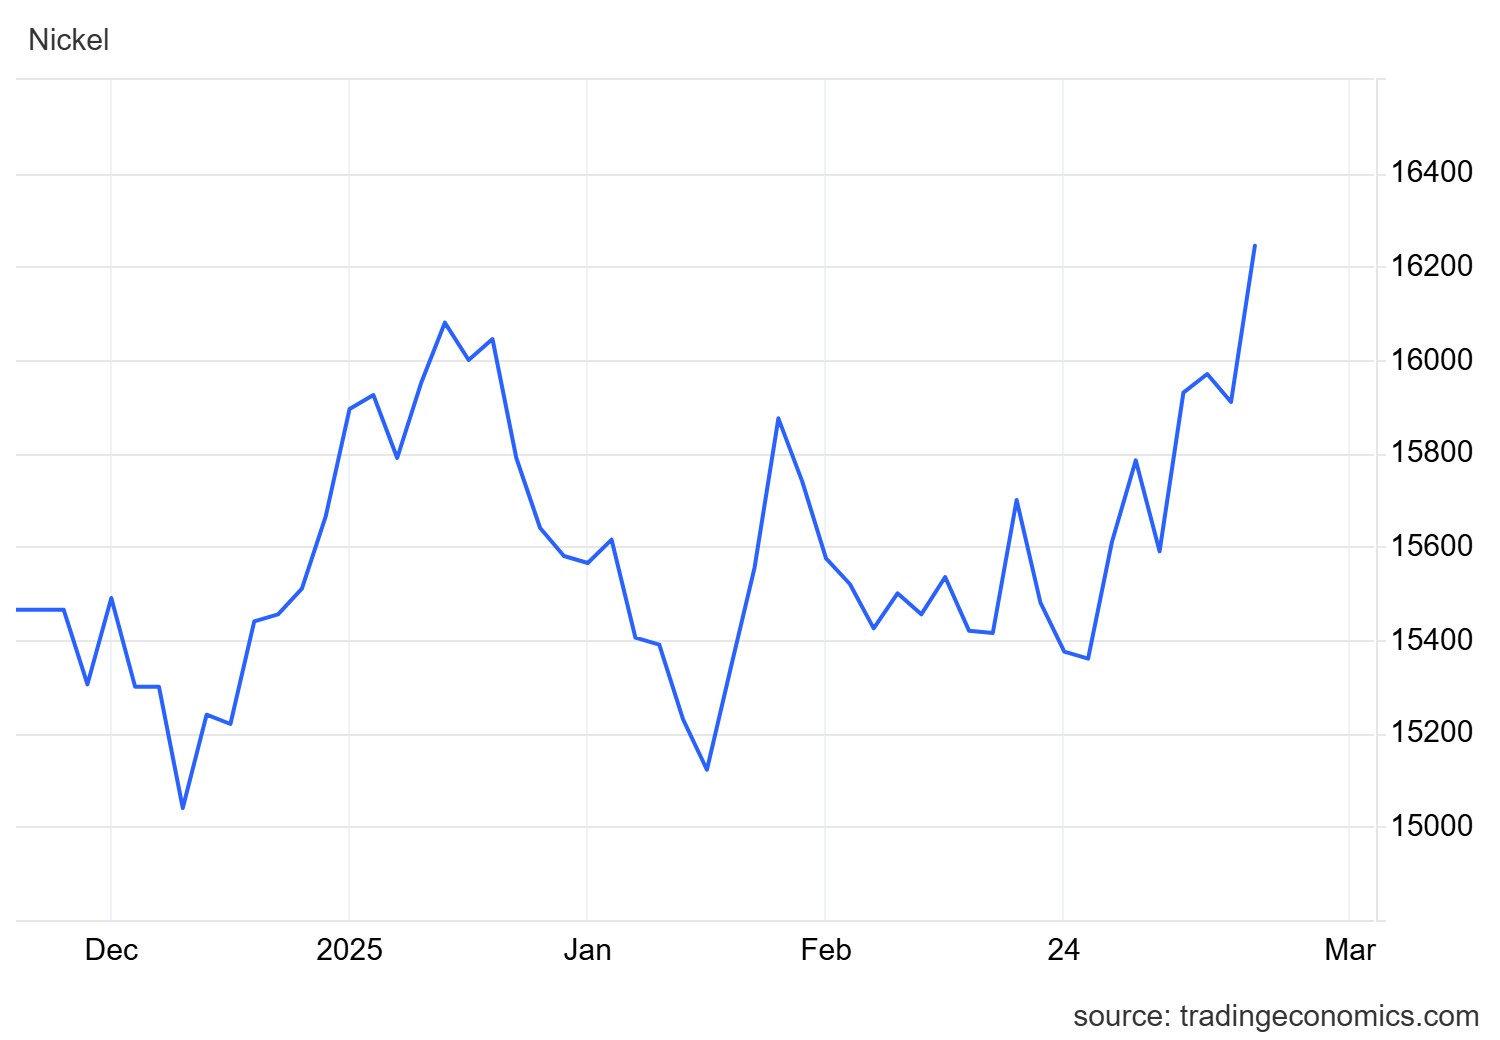
Plate mill plate lead times (weeks):
Domestic:
Stainless: 5 to 8 (no change)
Duplex: 7 to 9 (no change)
Nickel Alloys: 11 to 15 (was 7 to 14)
Carbon steel: 8 to 12 (was 5 to 8)
*Keep in mind, some plates will exceed the estimated ranges depending on the mill’s production schedule and slab availability.*
Welded tubing lead times (weeks):
Domestic:
Carbon: 4 to 12 (was 6 to 8)
Stainless: 8 to 12 (no change)
Nickel Alloy: 6 to 14 (was 10 to 14)
Import:
Carbon: 14 to 25 (no change)
Stainless: 16 to 30 (no change)
Nickel Alloy: 16 to 42 (no change)
Seamless tubing lead times (weeks):
Domestic:
Carbon: 6 to 26 (no change)
Stainless: 8 to 26 (no change)
Nickel Alloy: 8 to 12 (no change)
*Lead times are accurate if hollows are in stock. If not, lead times can increase to 44 weeks as most hollows are of foreign melt.*
Please don’t hesitate to reach out if you have any questions about the current state of our industry’s material supply chain.
Here’s the current surcharge chart for 304/304LSS, 316/316LSS, 2205, C276, and 625.
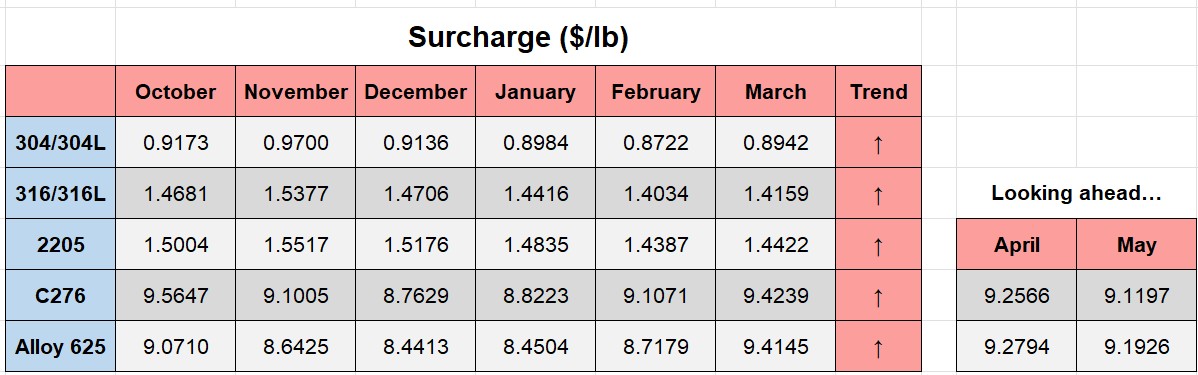
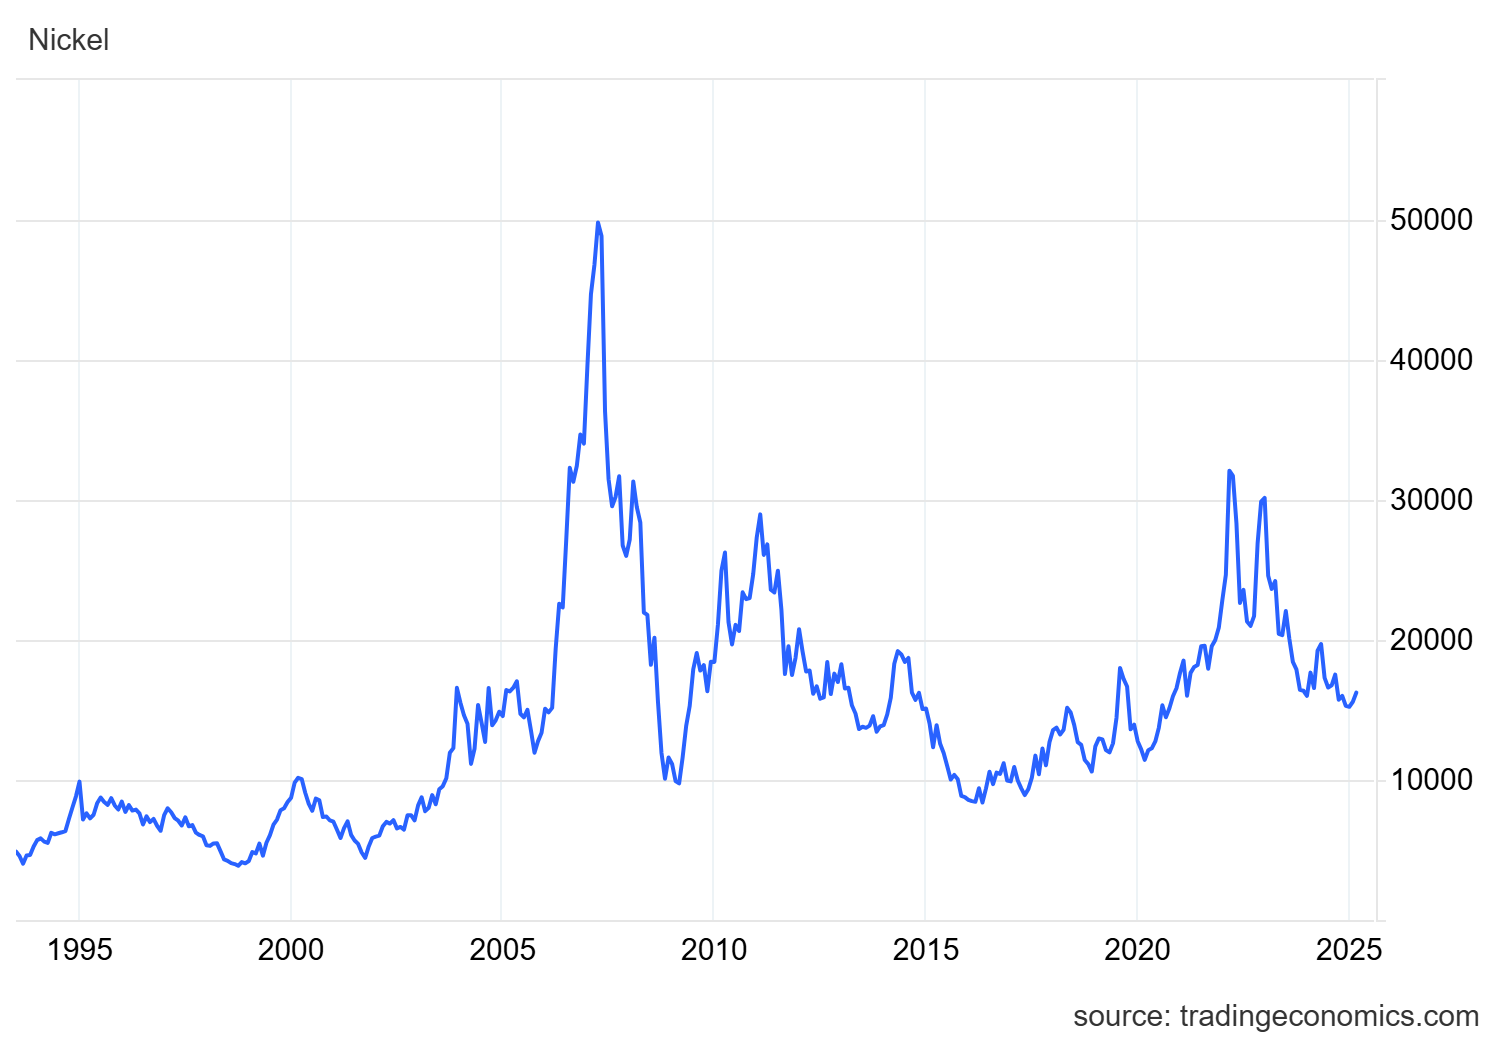
Nickel Prices have had an interesting ride over the past two decades with a low of $2.20/lb. in October of 2001 (following September 11 events) and a high of $23.72/lb. in May of 2007. Surcharges trail Nickel prices by approximately two months, so they would have been at their lowest in December of 2001 (304 was $0.0182/lb.) with the peak in July of 2007 (304 was $2.2839/lb.).
The chart below illustrates Nickel price by way of U.S. Dollars per Metric ton.
Here’s the Price Index for Hot Rolled Bars, Plate, and Structural Shapes.


