The ISM Manufacturing PMI registered 49 percent in March, 1.3 percentage points lower than the 50.3 percent recorded in February. The overall economy continued in expansion for the 59th month after one month of contraction in April 2020. (Important data point reference: A Manufacturing PMI reading above 50 percent indicates that the manufacturing economy is generally expanding; below 50 percent indicates it is generally declining. A Manufacturing PMI above 42.5 percent, over a period of time, indicates that the overall economy, or gross domestic product (GDP), is generally expanding; below 42.5 percent, it is generally declining. The distance from 50 percent or 42.5 percent indicates the extent of the expansion or decline.)
The Conference Board Consumer Confidence Index declined again by 5.4 points in March to 92.9 (1985=100).
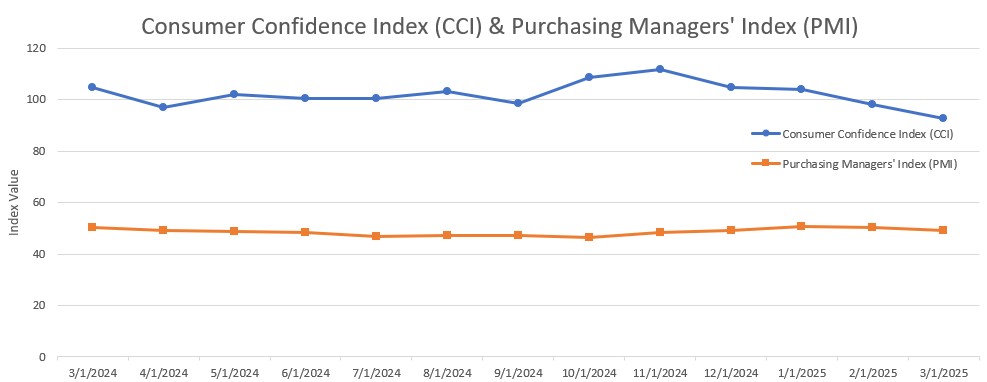
Other Notable Indexes:
New Orders: 45.2 (from 48.6)
Production: 48.3 (from 50.7)
Prices: 69.4 (from 62.4)
Backlog of Orders: 44.5 (from 46.8)
Employment: 44.7 (from 47.6)
Expectations: 65.2 (from 72.9)
Present Situation: 134.5 (from 136.5)
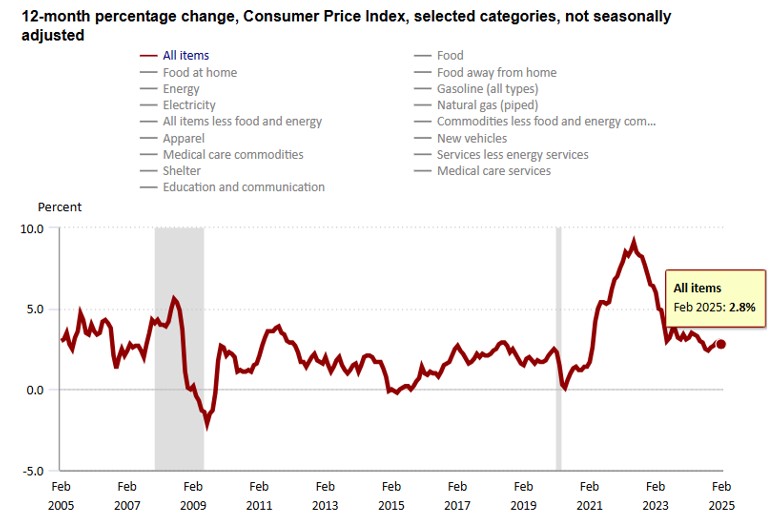
The Consumer Price Index (CPI, otherwise known as our “inflation” friend) is currently at 2.8% as of February 2025, down from 3.0% in January 2025. CPI tracks the rate of change in US inflation over time, and the following shows the trends over the past 20 years.
WTI Crude Oil is now bouncing around the $60 per barrel mark, not crossing the $80 mark since July 2024. Recently, eight OPEC+ countries unexpectedly announced they would increase oil production by 411,000 barrels per day in May, far more than the planned 135,000 bpd. OPEC cited strong market fundamentals but said future increases could be paused if needed. Oil was already down over 4% after U.S. President Trump announced new tariffs, sparking fears of a global trade war that could slow economic growth and reduce fuel demand. While oil imports were exempt, investors worried the tariffs could still hurt the economy and inflation. Also, US crude inventories unexpectedly rose by 6.2 million barrels last week, contrary to forecasts of a 2-million-barrel draw, driven by a surge in Canadian imports.
WTI Crude Oil Pricing ($/Bbl):
Mar. 3rd: 68.37 (enter)
Mar. 10th: 66.03 (monthly low)
Mar. 31st: 71.48 (exit, monthly high)
As of 4/8/25, WTI Crude Oil is at $61.60 per barrel…
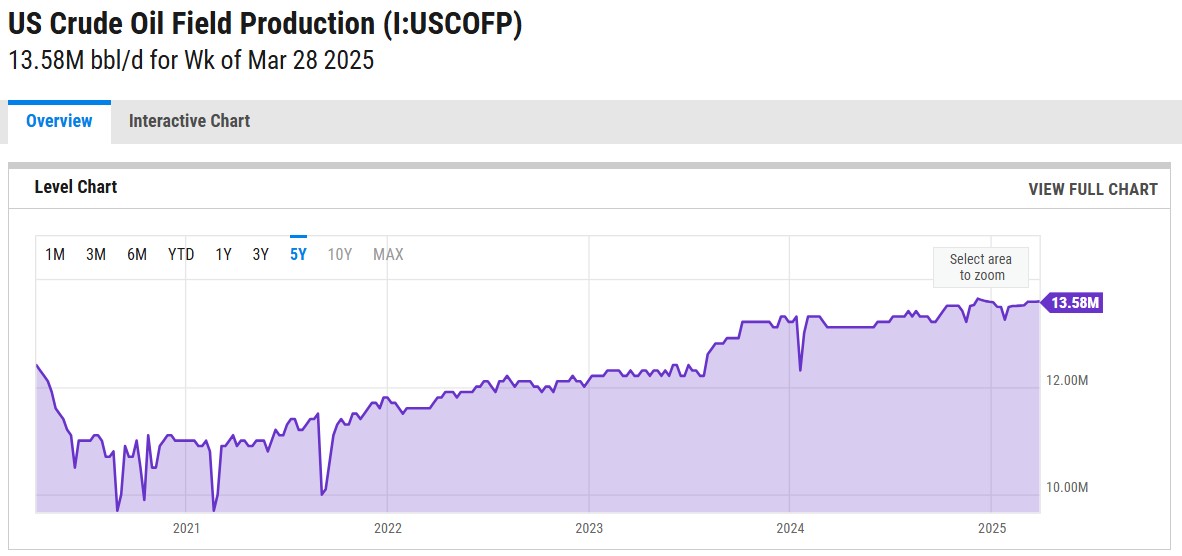
The online US Oil Rig Count is currently reported as 590 which is down 3 compared to last month’s report and down 30 from April 5 of 2024. This key and leading indicator shows the current demand for products used in drilling, completing, producing, and processing hydrocarbons which all of us use every day as fuel sources and finished products.
The number of rigs conducting oil and gas drilling in the United States continues to remain stagnant but efficiency has increased a lot over the years, as you can see from the chart below. We are now drilling at record production levels. This trend of fewer rigs however still reflects the priority of drillers to focus on efficiency and enhancing shareholder returns rather than expanding production through capital investments due to the previous administration’s desire to move away from fossil fuels. This philosophy might be changing now that the Trump administration is fully behind fossil fuels. To provide context, in 2019, 954 rigs were drilling for oil and gas in the US, and, in 2014, there were 1609 rigs before oil prices dropped below $20 per barrel at the end of that year.
Tariffs have tightened and will continue to evolve as the Trump administration reopens global negotiations.
Whew… there’s A LOT to unpack here, so hold on for the ride.
A little background on where all of this started and what it means. Tariffs are duties placed on foreign goods, paid by domestic importers to Customs and Border Patrol at ports of entry. President Trump introduced tariffs on select Chinese goods in his first term, which President Joe Biden later maintained, along with duties on steel and aluminum from most countries. In February, Trump reinstated tariffs—10% more on Chinese imports, bringing them to 35%, and 25% on Mexican and Canadian goods (except for oil, taxed at 10%). However, these tariffs on Canada and Mexico were temporarily paused after both countries reaffirmed commitments to border security cooperation with the U.S.
Just after midnight on Tuesday, March 4th, President Donald Trump imposed 25% tariffs on all Mexican and Canadian imports, with a lower 10% tariff on Canadian energy. He also doubled existing tariffs on Chinese products to 20%, on top of the old 25% tariff. In response, China imposed up to 15% tariffs on some U.S. imports, while Canada introduced a 25% levy. Mexican President Claudia Sheinbaum announced that Mexico would impose tariffs on U.S. goods by Sunday but did not provide details.
On Thursday, March 6th, President Trump announced a pause on tariffs for all Mexican and Canadian imports covered under the United States–Mexico–Canada Agreement (USMCA) until April 2.
President Trump defended the new tariffs as a measure to correct the trade deficit and curb fentanyl trafficking from China, Canada, and Mexico. “It may take some adjusting,” he told Congress on Tuesday, “but trust me, this will be even better.”
Now, to today, April 8th, the United States has implemented significant changes to its tariff policies under President Donald Trump.?
- Universal 10% Tariff: Effective April 5, a baseline 10% tariff has been imposed on all imported goods, with exceptions for Canada and Mexico.
- Country-Specific Tariffs: Starting April 9, higher tariffs will target specific countries based on trade imbalances and perceived unfair practices. Notable examples include:?
- China: An additional 34% tariff, totaling 54% when combined with existing duties.
- Vietnam: 46% tariff.?
- European Union: 20% tariff.
These measures have elicited varied international reactions. Over 50 nations have approached the U.S. to negotiate terms, though U.S. officials have indicated the tariffs are non-negotiable. China has warned of potential countermeasures if the tariffs are not lifted. ?
Domestically, the tariffs have prompted bipartisan legislative responses. Senators Chuck Grassley and Maria Cantwell introduced the Trade Review Act, aiming to require congressional approval for future tariffs.
The financial markets have reacted negatively; the Dow Jones Industrial Average experienced significant declines, and economists have voiced concerns about a potential recession.
The impact of these tariffs will be interesting to see unfold and could be significant for U.S.-based manufacturers of pressure vessels and heat exchangers. Many of these manufacturers rely on imported raw materials and components. The imposed tariffs will lead to higher costs for these imports, potentially disrupting supply chains and increasing production expenses. Manufacturers will need to properly evaluate their supplier base to ensure they stay as competitive as possible.
While the tariffs may increase raw materials and components costs, they will also provide a much more competitive advantage for U.S.-based pressure vessel and heat exchanger manufacturers. The government effectively makes imported products more expensive by imposing tariffs on foreign-made pressure vessels and heat exchangers. This could lead to several potential benefits for domestic manufacturers: reduced foreign competition, increased market share, encouragement for domestic investment, potential price stabilization in our market, and a boost in government and industrial contracts. Overall, it boosts the purchase of American-made products, which is good for American workers.
In summary, while the tariffs aim to help and protect domestic industries, they will pose challenges for U.S.-based pressure vessel and heat exchanger manufacturers by increasing operational costs and complicating supply chain logistics. However, the benefits can outweigh the drawbacks and will depend highly on how well domestic manufacturers adapt to increased material costs and whether demand shifts significantly in their favor. If manufacturers can efficiently manage costs and scale production, they could gain long-term advantages from the trade policies.
The administration has published this fact sheet (click here) on the White House website.
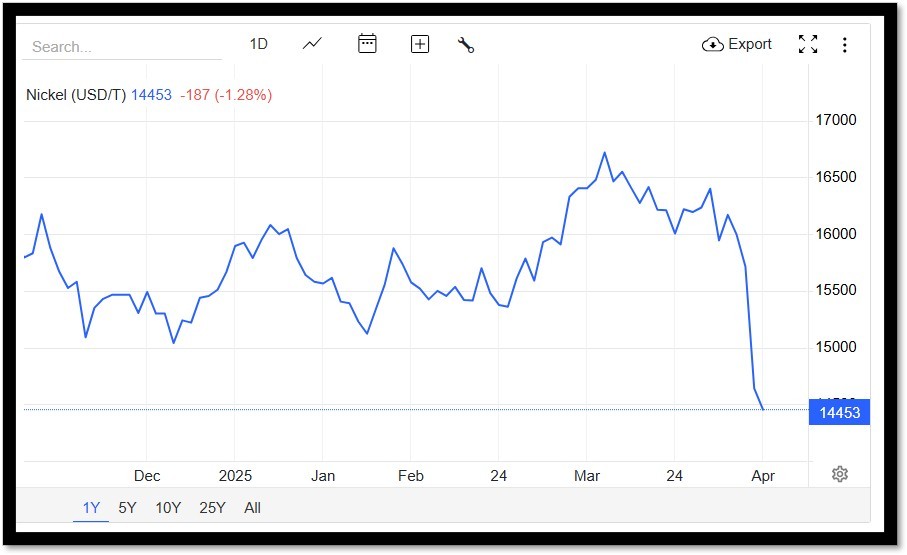
Nickel continues to drop, now at the lowest level since September 2020, amid trade war concerns and a supply glut from Indonesia. The US imposed a 25% tariff on aluminum, disrupting global markets, while potential levies on copper have fueled price volatility. The trade war escalated after China announced a 34% tariff on all US imports and export controls on rare earths starting April 10, in response to recent US tariffs imposed by President Trump. Meanwhile, rising nickel stockpiles on the London Metal Exchange (LME) are adding to the pressure, with Chinese-processed Indonesian nickel now accounting for over 50% of LME inventories—up from just 11% at the start of 2024. Indonesia’s surging refined metal output is further saturating the market, squeezing margins even for domestic producers.
Nickel Pricing ($/lb):
Mar. 3rd: 7.226 (enter, monthly low)
Mar. 12th: 7.584 (monthly high)
Mar. 31st: 7.233 (exit)
Plate mill plate lead times (weeks):
Domestic:
Stainless: 4 to 7 (was 5 to 8)
Duplex: 4 to 6 (was 7 to 9)
Nickel Alloys: 6 to 14 (was 11 to 15)
Carbon steel: 9 to 13 (was 8 to 12)
*Keep in mind, some plates will exceed the estimated ranges depending on the mill’s production schedule and slab availability.*
Welded tubing lead times (weeks):
Domestic:
Carbon: 6 to 16 (was 4 to 12)
Stainless: 8 to 12 (no change)
Nickel Alloy: 6 to 14 (no change)
Import:
Carbon: 14 to 25 (no change)
Stainless: 16 to 30 (no change)
Nickel Alloy: 16 to 42 (no change)
Seamless tubing lead times (weeks):
Domestic:
Carbon: 6 to 26 (no change)
Stainless: 8 to 26 (no change)
Nickel Alloy: 8 to 12 (no change)
*Lead times are accurate if hollows are in stock. If not, lead times can increase to 44 week as most hollows are of foreign melt.*
At Ward, our focus remains clear — delivering high-quality equipment and projects on time while providing an exceptional fabrication experience. We’re committed to transparency, collaboration, and smart solutions in the face of evolving market conditions. As always, we want to work through these challenges together, so let us know your thoughts. Please don’t hesitate to reach out if you have any questions about the current state of our industry’s material supply chain.
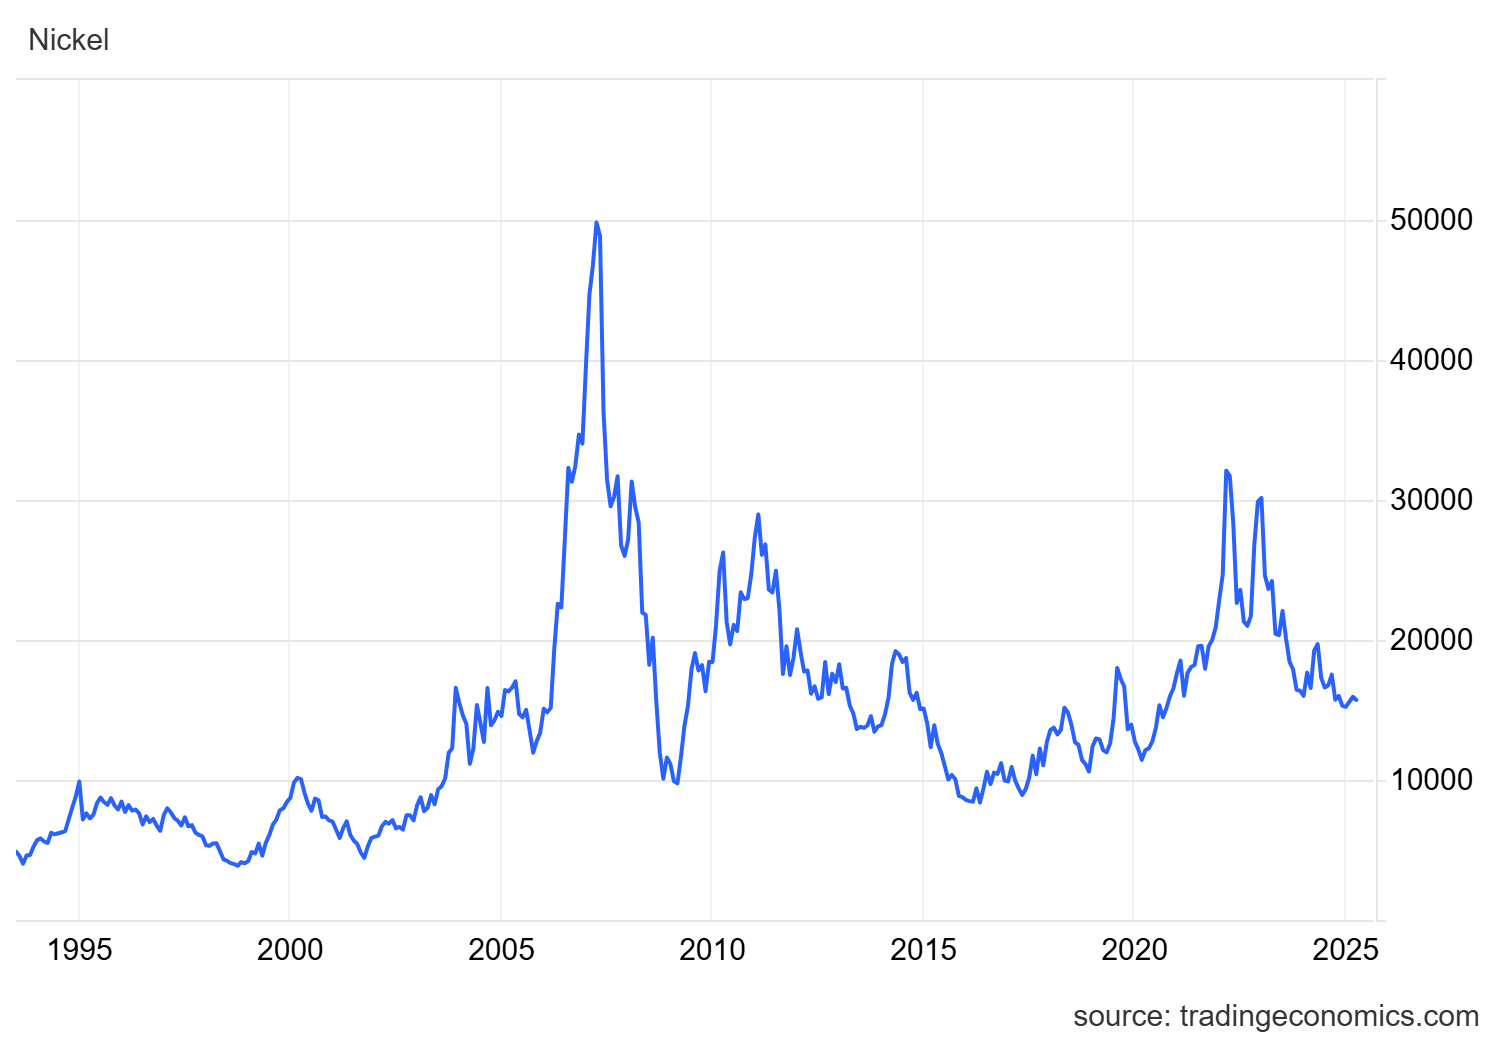
Below is the 90 day Nickel Price Trend (US$ per tonne).
Here’s the current surcharge chart for 304/304LSS, 316/316LSS, 2205, C276, and 625.
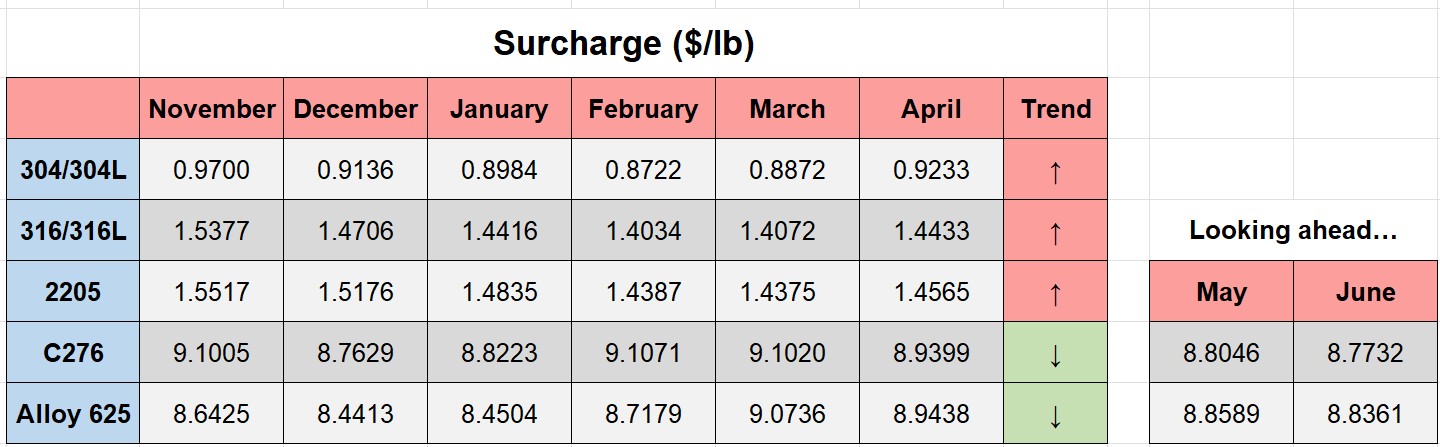
Nickel Prices have had an interesting ride over the past two decades with a low of $2.20/lb. in October of 2001 (following September 11 events) and a high of $23.72/lb. in May of 2007. Surcharges trail Nickel prices by approximately two months, so they would have been at their lowest in December of 2001 (304 was $0.0182/lb.) with the peak in July of 2007 (304 was $2.2839/lb.).
The chart below illustrates Nickel price by way of U.S. Dollars per Metric ton.
Here’s the Price Index for Hot Rolled Bars, Plate, and Structural Shapes.