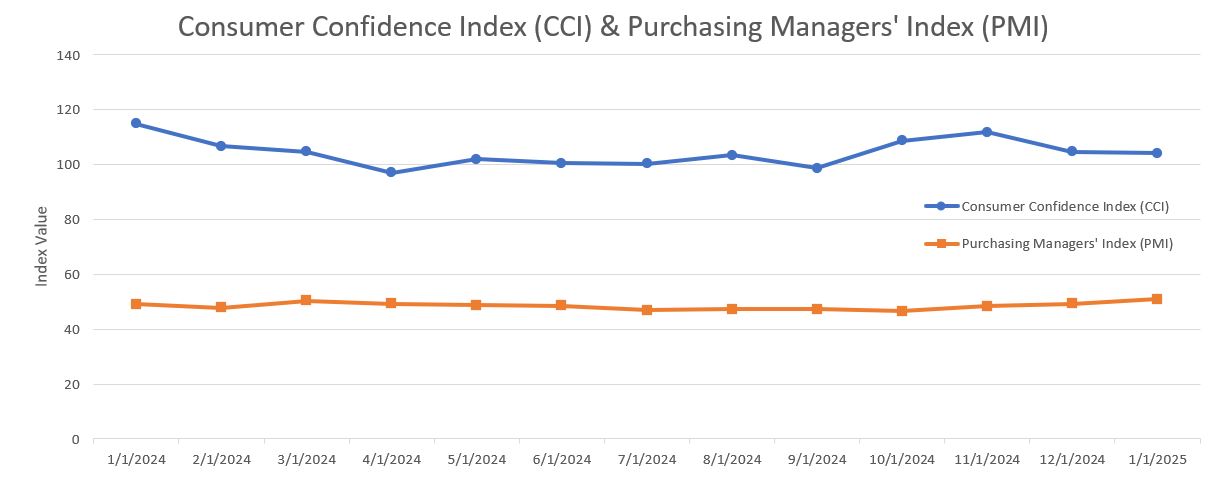
The ISM Manufacturing PMI was 48 percent in July, a 1-percentage point decrease compared to the 49 percent recorded in June. The overall economy continued in expansion for the 63rd month after one month of contraction in April 2020. (Important data point reference: A Manufacturing PMI reading above 50 percent indicates that the manufacturing economy is generally expanding; below 50 percent indicates that it is generally declining. A Manufacturing PMI above 42.5 percent, over a period of time, indicates that the overall economy, or gross domestic product (GDP), is generally expanding; below 42.5 percent, it is generally declining. The distance from 50 percent or 42.5 percent is indicative of the extent of the expansion or decline.)
The Conference Board Consumer Confidence Index improved by 4.2 points in July to 97.2 from 93.0 in June.
Other Notable Indexes:
New Orders: 47.1 (from 46.4)
Production: 51.4 (from 50.3)
Prices: 64.8 (from 69.7)
Backlog of Orders: 46.8 (from 44.3)
Employment: 43.4 (from 45.0)
Present Situation: 131.5 (from 129.1)
Expectations: 74.4 (from 69.0)
The Consumer Price Index (CPI, otherwise known as our “inflation” friend) is currently at 2.7% as of June 2025, up from 2.4% in May 2025. CPI tracks the rate of change in US inflation over time, and the following shows the trends over the past 20 years.

WTI Crude Oil futures rose to above $64 per barrel on Friday (8/8/25), but are still near a two-month low and heading for a more than 4% weekly decline, its worst since late June, pressured by easing supply disruption concerns. A Kremlin official confirmed that Presidents Trump and Putin will meet in the coming days, marking their first summit since 2021, while a White House official said the meeting could take place as early as next week. Optimism over potentially productive US-Russia talks on the Ukraine war has eased supply concerns, despite US sanctions on India for continuing to import Russian oil. Earlier in the week, Trump imposed a new 25% tariff on Indian goods in response to its ongoing purchases of Russian crude and hinted at possible additional tariffs on China. Meanwhile, expectations of increased OPEC output and persistent trade tensions remain as the overriding negative consideration, raising concerns about slowing economic growth and weakening demand.
WTI Crude Oil Pricing ($/Bbl):
July 1st: 65.45 (enter)
July 25th: 65.16 (monthly low)
July 30th: 70.00 (monthly high)
July 31st: 69.26 (exit)
The online US Oil Rig Count is currently reported as 539 which is down 0 compared to last month’s report and up 49 from August 9 of 2024. This key and leading indicator shows the current demand for products used in drilling, completing, producing, and processing hydrocarbons, which all of us use every day as fuel sources and finished products.
The number of rigs conducting oil and gas drilling in the United States continues to remain stagnant but efficiency has increased a lot over the years, as you can see from the chart below. We are drilling at record production levels. This trend of fewer rigs however still reflects the priority of drillers to focus on efficiency and enhancing shareholder returns rather than expanding production through capital investments due to the previous administration’s desire to move away from fossil fuels. This philosophy might be changing now that the Trump administration is fully behind fossil fuels. To provide context, in 2019, 954 rigs were drilling for oil and gas in the US, and, in 2014, there were 1609 rigs before oil prices dropped below $20 per barrel at the end of that year.

Tariffs have tightened, untightened, and will continue to evolve as the Trump administration navigates global negotiations.
Whew… there’s A LOT to unpack here, so hold on for the roller coaster ride.
A little background on where all of this started and what it means. Tariffs are duties placed on foreign goods, paid by domestic importers to Customs and Border Patrol at ports of entry. President Trump introduced tariffs on select Chinese goods in his first term, which President Joe Biden later maintained, along with duties on steel and aluminum from most countries. In February, Trump reinstated tariffs—10% more on Chinese imports, bringing them to 35%, and 25% on Mexican and Canadian goods (except for oil, taxed at 10%). However, these tariffs on Canada and Mexico were temporarily paused after both countries reaffirmed commitments to border security cooperation with the U.S.
As of August 12th, 2025 at 11:15 am, we are looking at the following.
As of mid-August 2025, the U.S. has established some of the highest tariff levels in decades, with broad-based reciprocal tariffs in place, deep country-specific penalties for nations like India and Brazil, and a pivotal deadline looming for China. Domestic fallout is mounting—consumers and businesses face rising costs, legal challenges continue to swirl, and global trade tensions are escalating.
Key Developments
1 – Sweeping Reciprocal Tariffs (Effective August 7, 2025)
On August 7, the US fully implemented “reciprocal tariffs” impacting dozens of countries, with rates ranging from 10% to 50%. The average effective US tariff rate has climbed to approximately 18.6%, matching levels not seen since the 1930s. The US federal revenue from tariffs has soared, reaching about 5% of total revenue, up from a historical norm of around 2%.
2 – Country-Specific Tariff Rates
European Union, Japan, South Korea — tariffs set at 15%.
United Kingdom — reduced to 10%.
Canada — facing 35% tariffs (up from ~25%).
India — at 25%, with plans for an additional 25% due to its purchases of Russian oil (raising it to 50%) effective August 27.
Brazil and others are similarly subject to steep rates, sometimes as high as 50%, depending on trade practices.
3 – The 90-day tariff truce between the U.S. and China was set to expire on August 12, 2025. Trump just signed an executive order extending the US–China tariff truce for another 90 days, just hours before a key deadline that now falls on November 9. The move, expected after a third round of US–China talks in Stockholm this July, follows the initial 90-day truce reached in May. At that time, the U.S. reduced tariffs on Chinese goods to 30%, while China lowered its tariffs on U.S. goods to 10% and resumed rare earth metal exports. The extension allows Trump to meet with Russian President Vladimir Putin this Friday before taking action against China over its purchases of Russian oil. It also ensures the trade pause will remain in effect when Trump and Chinese President Xi Jinping are slated to attend the same international summit in South Korea this October.
The impact of these tariffs has been interesting to see unfold and could be significant for US-based manufacturers of pressure vessels and heat exchangers. Many of these manufacturers rely on imported raw materials and components. The imposed tariffs will lead to higher import costs, potentially disrupting supply chains and increasing production expenses. Manufacturers must properly evaluate their supplier base to ensure they stay as competitive as possible.
While the tariffs may increase raw materials and components costs, they will also provide a much more competitive advantage for US-based pressure vessel and heat exchanger manufacturers. The government effectively makes imported products more expensive by imposing tariffs on foreign-made pressure vessels and heat exchangers. This could lead to several potential benefits for domestic manufacturers: reduced foreign competition, increased market share, encouragement for domestic investment, potential price stabilization in our market, and a boost in government and industrial contracts. Overall, it boosts the purchase of American-made products, which is good for American workers.
In summary, while the tariffs aim to help and protect domestic industries, they will pose challenges for US-based pressure vessel and heat exchanger manufacturers by increasing operational costs and complicating supply chain logistics. However, the benefits can outweigh the drawbacks and will depend highly on how well domestic manufacturers adapt to increased material costs and whether demand shifts significantly in their favor. If manufacturers can efficiently manage costs and scale production, they could gain long-term advantages from the trade policies.
The administration has published this fact sheet (click here) on the White House website.
Nickel futures fell below $6.849 per pound in August, fully erasing gains since the start of the year and extending its bearish trend since late 2022. Prices continued to be pressured by the overexpansion of Indonesia’s nickel sector since the country blocked the export of ores in 2020. This drove the largest nickel consumers to establish refiners within Indonesia and capacity soared, leading to supply surpluses. The Indonesian government reduced nickel mining quotas by 120 million tons to 150 million this year, cutting global supply by 35% from current levels, although soft bidding prices throughout the year indicated that markets don’t see constraints dampening the oversupplied backdrop. Available nickel stockpiles at LME warehouses rose by 40,000 tons this year to 195,000, aligned with robust Chinese refiners in Indonesia. On the demand front, manufacturing demand remained weak per Chinese PMIs, while Beijing’s push to limit battery capacity also limited the outlook for buying.
Nickel Pricing ($/lb):
July 1st: 6.890 (enter)
July 23rd: 7.065 (monthly high)
July 31st: 6.781 (monthly low, exit)
Plate mill plate lead times (weeks):
Domestic:
Stainless: 6 to 7 (was 4 to 8)
Duplex: 6 to 7 (was 4 to 8)
Nickel Alloys: 8 to 10 (was 7 to 10)
Carbon steel: 6 to 8 (was 9 to 12)
*Keep in mind, some plates will exceed the estimated ranges depending on the mill’s production schedule and slab availability.*
Welded tubing lead times (weeks):
Domestic:
Carbon: 6 to 16 (no change)
Stainless: 8 to 12 (no change)
Nickel Alloy: 8 to 16 (no change)
Import:
Carbon: 14 to 25 (no change)
Stainless: 16 to 30 (no change)
Nickel Alloy: 16 to 42 (no change)
Seamless tubing lead times (weeks):
Domestic:
Carbon: 6 to 26 (no change)
Stainless: 8 to 26 (no change)
Nickel Alloy: 12 to 18 (no change)
*Lead times are accurate if hollows are in stock. If not, lead times can increase to 44 weeks as most hollows are of foreign melt.*
At Ward, our focus remains clear — delivering high-quality equipment and projects on time while providing an exceptional fabrication experience. We’re committed to transparency, collaboration, and smart solutions in the face of evolving market conditions. As always, we want to work through these challenges together, so let us know your thoughts. Please don’t hesitate to reach out if you have any questions about the current state of our industry’s material supply chain.
Here’s the current surcharge chart for 304/304LSS, 316/316LSS, 2205, C276, and 625.

Below is the 90-day Nickel Price Trend (US$ per tonne).

Nickel Prices have had an interesting ride over the past three decades, with a low of $2.20/lb. in October 2001 (following the September 11 events) and a high of $23.72/lb. in May 2007. Surcharges trail Nickel prices by approximately two months, so they would have been at their lowest in December 2001 (304 was $0.0182/lb.) and peak in July 2007 (304 was $2.2839/lb.).
The chart below illustrates Nickel price by way of U.S. Dollars per Metric ton.

Here’s the Price Index for Hot Rolled Bars, Plate, and Structural Shapes.


