Economic activity in the manufacturing sector contracted in November for the ninth consecutive month, following a two-month expansion preceded by 26 straight months of contraction, say the nation’s supply executives in the latest ISM Manufacturing PMI Report.
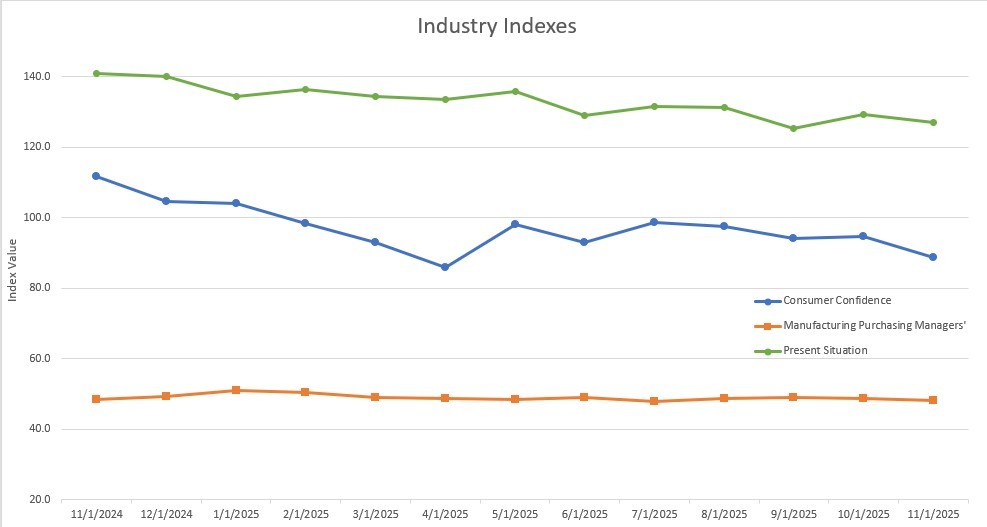
The Manufacturing PMI registered 48.2 percent in November, a 0.5-percentage point decrease compared to the reading of 48.7 percent in October. The overall economy continued in expansion for the 67th month after one month of contraction in April 2020. (Important data point reference: A Manufacturing PMI reading above 50 percent indicates that the manufacturing economy is generally expanding; below 50 percent indicates that it is generally declining. A Manufacturing PMI above 42.5 percent, over a period of time, indicates that the overall economy, or gross domestic product (GDP), is generally expanding; below 42.5 percent, it is generally declining. The distance from 50 percent or 42.5 percent is indicative of the extent of the expansion or decline.)
The Conference Board Consumer Confidence Index declined by 6.8 points in November to 88.7 from the upwardly revised 95.5 in October. The Present Situation Index, also produced by the Conference Board, dipped as well as consumers were less sanguine about current business and labor market conditions.
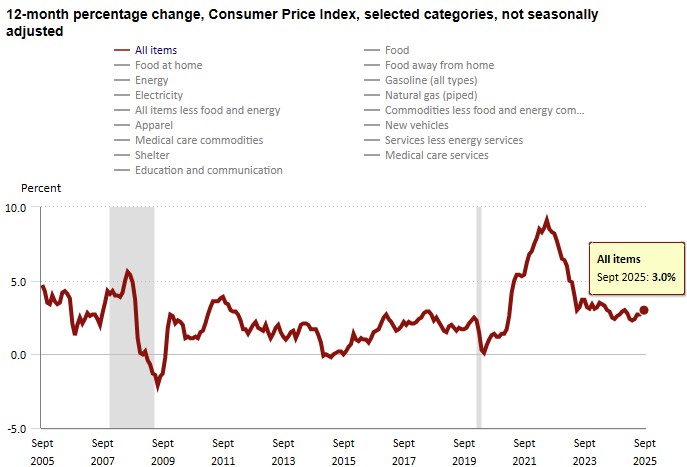
The Consumer Price Index (CPI, otherwise known as our “inflation” friend) is currently at 3.0% as of September 2025, up from 2.9% in August 2025. This Index has not been updated yet for October due to the government shutdown. CPI tracks the rate of change in US inflation over time, and the following shows the trends over the past 20 years.
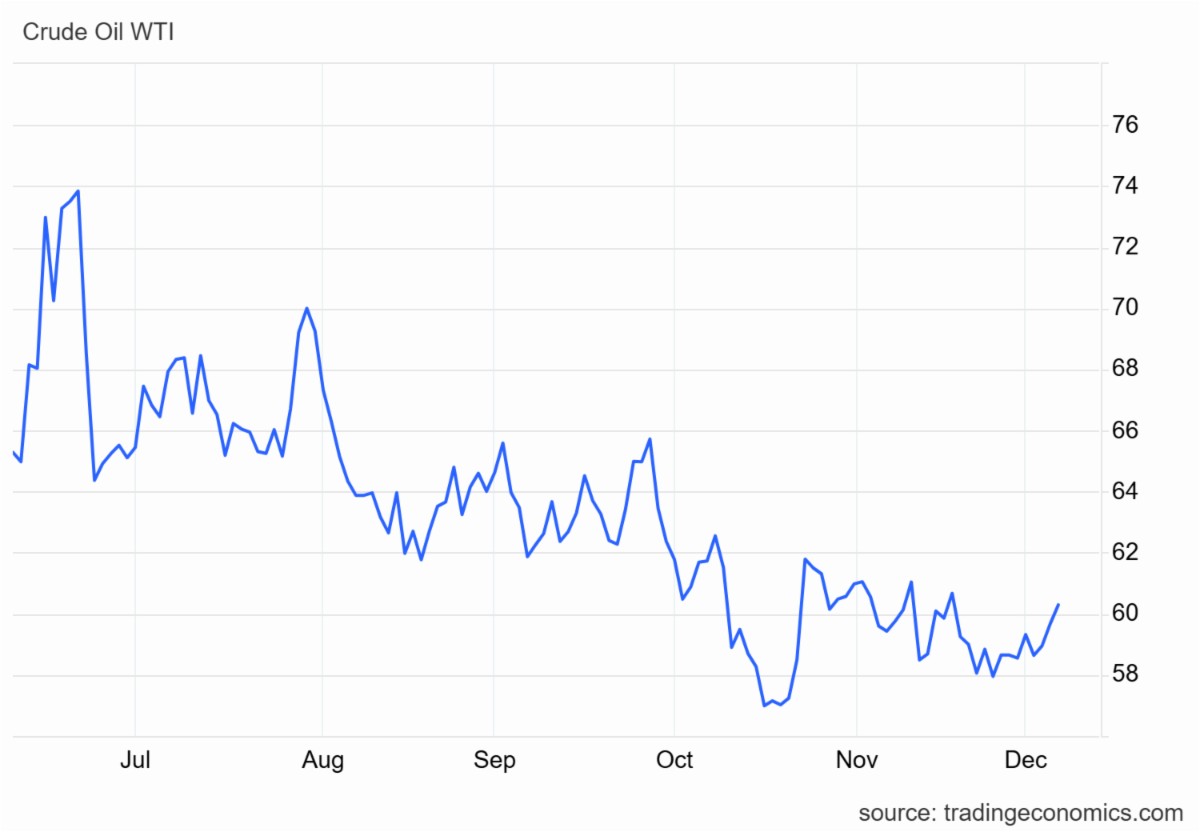
WTI Crude Oil futures hovered around $59.7 per barrel on Friday, holding at a two-week high and remaining on track for a weekly gain, driven by geopolitical risk premium. Traders continued to watch for a possible US move in Venezuela after President Donald Trump signaled imminent action against the oil giant, with Rystad Energy warning that any escalation could threaten the country’s 1.1 million bpd of crude output. Prices were also supported by the lack of progress in US talks in Moscow over the Ukraine war, which reduced the near-term prospects for restoring Russian supply, while Ukraine continued targeting Russian energy infrastructure. Expectations of a US rate cut, which could stimulate economic activity and boost oil demand, also added upward pressure. Still, concerns over demand and potential oversupply capped gains, with Saudi Arabia lowering its January Arab light crude price for Asia to its lowest level in five years, while Canadian oil tumbles to its weakest since March.
The online US Oil Rig Count is currently reported as 549, which is up 3 compared to last month’s report and down 40 from December 06, 2024. This key and leading indicator shows the current demand for products used in drilling, completing, producing, and processing hydrocarbons, which we all use every day as fuel sources and finished products.
The number of rigs conducting oil and gas drilling in the United States remains stagnant, but efficiency has increased significantly over the years, as shown in the chart below. We are drilling at or near record production levels. However, this trend of fewer rigs still reflects the priority of drillers to focus on efficiency and enhancing shareholder returns rather than expanding production through capital investments due to the previous administration’s desire to move away from fossil fuels. This philosophy might change now that the Trump administration is entirely behind fossil fuels. To provide context, in 2019, 954 rigs were drilling for oil and gas in the US, and, in 2014, there were 1609 rigs before oil prices dropped below $20 per barrel at the end of that year.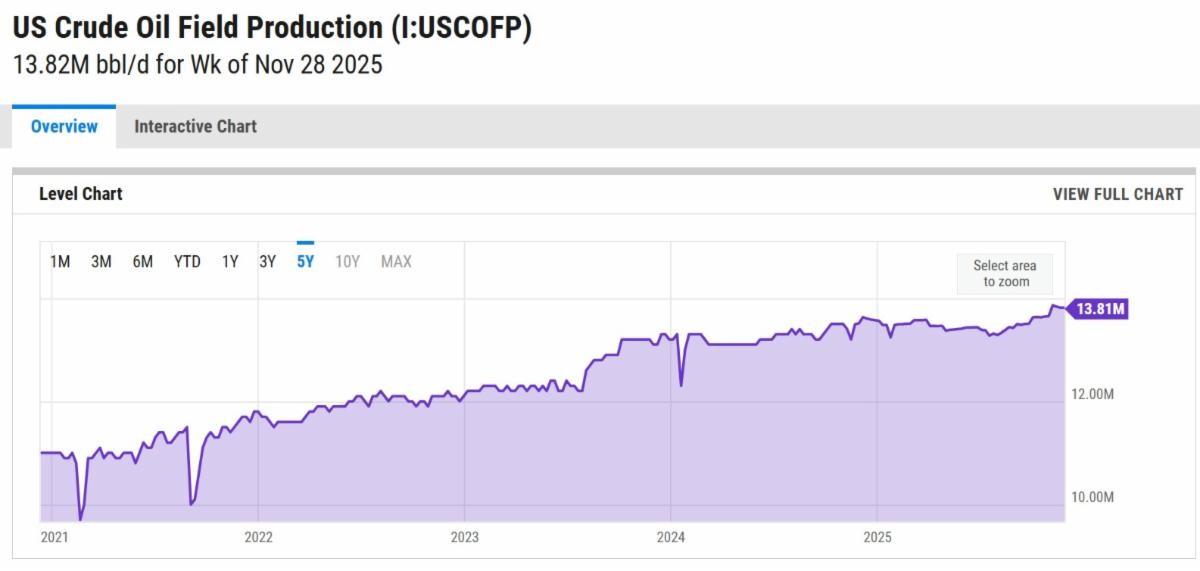
Tariffs have tightened, untightened, and will continue to evolve as the Trump administration navigates global negotiations.
Whew… There’s A LOT to unpack here, so hold on for the roller coaster ride.
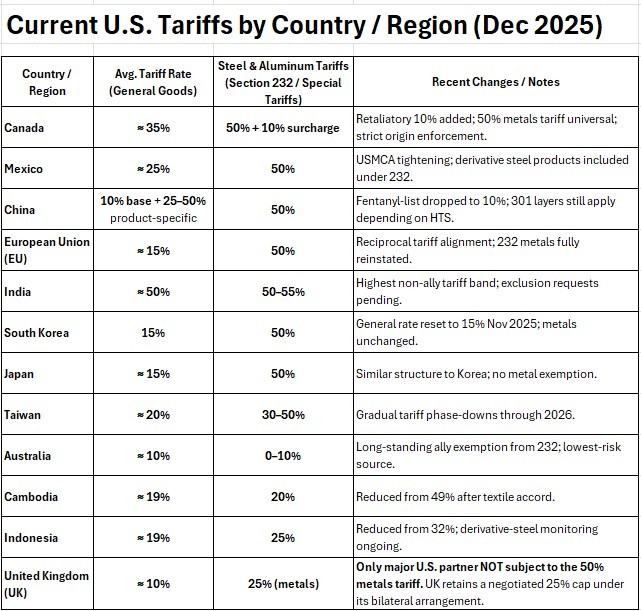
A little background on where all of this started and what it means. Tariffs are duties placed on foreign goods, paid by domestic importers to Customs and Border Patrol at ports of entry. President Trump introduced tariffs on select Chinese goods in his first term, which President Joe Biden later maintained, along with duties on steel and aluminum from most countries. In February, Trump reinstated tariffs—10% more on Chinese imports, bringing them to 35%, and 25% on Mexican and Canadian goods (except for oil, taxed at 10%). However, these tariffs on Canada and Mexico were temporarily paused after both countries reaffirmed commitments to border security cooperation with the U.S.
As of December 9, 2025, at 10:40 am EST, U.S. tariff policy is still in flux but trending tighter across broad categories, with several fast-moving legal and policy shifts.
Where things stand now…
Reciprocal tariffs face legal trouble. On Aug. 29, 2025, the U.S. Court of Appeals for the Federal Circuit held that most of the Trump Administration’s “reciprocal tariffs” exceeded presidential authority under IEEPA. The administration seeks Supreme Court review; portions remain in effect pending further proceedings and agency guidance. Here is the timeline of this important ruling.
JUL / AUG 2025 – Circuit split & cert granted
The appellate courts issue conflicting rulings on whether IEEPA authorizes reciprocal tariffs. The Supreme Court agrees to hear the case on an expedited schedule.
OCTOBER 2025 – Briefing completed
Business groups argue the tariffs are unauthorized and exceed presidential power. The Administration responds that IEEPA’s emergency authority allows tariff actions.
NOVEMBER 5, 2025 – Oral arguments
Justices express skepticism about using an “emergency” statute for a sweeping tariff program. Several question whether tariffs are effectively taxes requiring explicit congressional approval.
DECEMBER 2025 – Follow-on litigation begins
Companies begin filing protective lawsuits to preserve refund rights in case the Court ultimately overturns the tariffs.
FEB / JUN 2026 – Expected ruling
Possible outcomes:
- Court overturns the tariffs (most expected). Importers may receive refunds; IEEPA cannot be used to impose reciprocal tariffs.
- Court upholds the tariffs (less likely). Sweeping tariff authority under IEEPA remains intact.
- Middle position. Tariffs allowed only in a narrowly limited form; future use constrained.
De minimis is still suspended and gone for now. The long-standing duty-free threshold for shipments under $800 was terminated on Aug. 29, 2025 by executive action. International small-parcel flows fell by ~80% immediately after, as posts and carriers scrambled to comply; duties/fees now apply to those packages.
Metal tariffs widened and deepened. Section 232 steel/aluminum tariffs (now 50% in most cases) were expanded to cover hundreds of additional steel- and aluminum-containing products, straining the U.S.–EU truce and imposing additional burdens on origin tracing for importers.
The Trump administration and the People’s Republic of China agreed on a trade and economic deal. The U.S. will lower tariffs on certain Chinese-imports tied to the fentanyl supply chain from ~ 20 % to ~ 10 %, effective November 10.
The U.S. will suspend, for one year starting Nov 10, 2025, the responsive actions under Section 301 of the U.S.–China maritime, logistics & ship-building investigation.
The universal “reciprocal” tariff (applied broadly) remains at 10 % and will remain so until at least November 10, 2026, under the deal with China.
Canada/Mexico dynamics. Earlier in the year, planned across-the-board tariffs on Canada and Mexico were paused after border-security commitments; subsequent months saw rolling adjustments and compliance-based carve-outs under USMCA rules.
Canada has an additional 10% surcharge now after a recent TV ad dispute.
What does this mean for U.S. pressure vessel and heat exchanger manufacturers?
Price pressure on inputs – Expanded metals coverage and higher headline rates raise costs for imported plate, tube, fittings, and subassemblies, especially where origin tracing is complex.
Competitive tailwind on finished goods – Higher landed costs on foreign vessels and exchangers reduce price undercutting in bids, supporting U.S. share in industrial and government contracts (Inference from current tariff structure and coverage).
Procurement and compliance load – With de minimis gone and derivative-product rules widening, expect more broker work, HTS reclassifications, certificates of origin, and tighter vendor audits, particularly on mixed-origin fabrications.
Volatility risk – The legal overhang on reciprocal tariffs plus ongoing executive adjustments means terms can change quickly; quote validity windows and escalation clauses matter more now.
Bottom line – Tariffs currently favor domestic manufacturers of finished equipment by lifting competitors’ U.S. price floors, but they also raise input and compliance costs. Shops that lock in domestic steel where feasible, tighten origin documentation, and build flexible pricing into quotes are best positioned to capture the demand shift while managing volatility.
How does this affect your pressure vessel and heat exchanger pricing?
At Ward, we purchase 80-90% domestically depending upon the project and do not purchase any materials from China. This means that our total material spend has seen a rough 5-15% increase since the tariffs were enacted, resulting in a 3-10% overall unit price increase after labor is factored in. We are doing our part to support American manufacturing while keeping our pricing as competitive as possible.
The administration has published several tariff fact sheets on the White House website (click here) as the tariff topic has evolved.
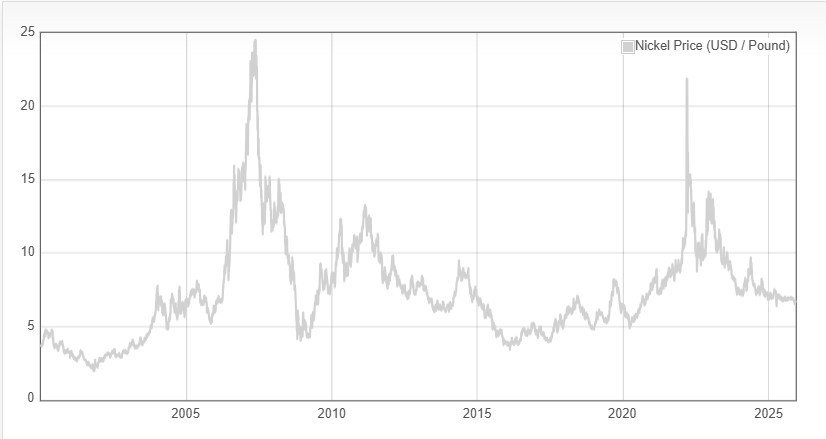
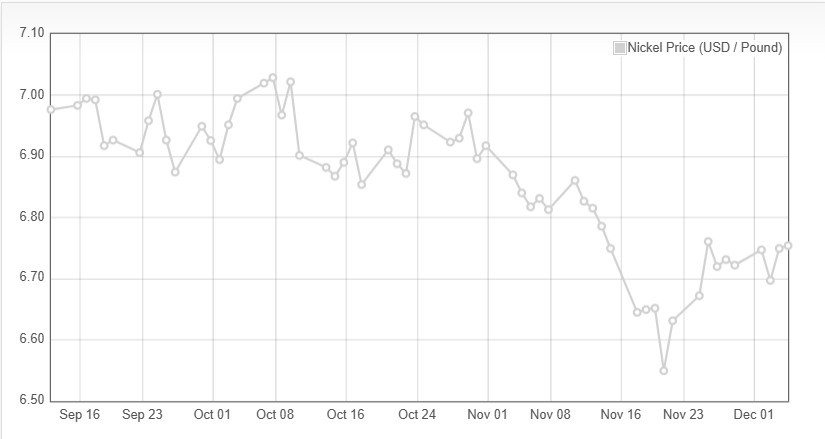
Nickel futures in the UK were at $6.713 per pound, rebounding after testing the four-year low of $6.557 on November 20th as markets reassessed the current magnitude of oversupply. The Indonesian government announced new rules that it would only grant nickel refining permits to refiners that produce intermediate products. It was the latest measure to curb oversupply of nickel since the over-expansion of the sector when Jakarta blocked the export of ores in 2020. This was followed by a reduction in nickel mining quotas by 120 million tons to 150 million this year, cutting global supply by 35% from current levels, which drove commodity giants to establish refiners within Indonesia and capacity soared, leading to supply surpluses. Nickel stockpiles at LME warehouses rose by 90,000 tonnes this year to over 250,000. On the demand front, muted purchasing levels of stainless steel globally were offset by the higher usage of nickel in electric vehicles.
Plate mill plate lead times (weeks):
Domestic:
Stainless & Duplex: 4 to 7 (no change)
Nickel Alloys: 6 to 11 (no change)
Carbon steel: 4 to 6 (no change)
*Keep in mind, some plates will exceed the estimated ranges depending on the mill’s production schedule and slab availability.*
Welded tubing lead times (weeks):
Domestic:
Carbon: 6 to 16 (no change)
Stainless: 8 to 15 (no change)
Nickel Alloy: 8 to 18 (no change)
Import:
Carbon: 14 to 25 (no change)
Stainless: 16 to 30 (no change)
Nickel Alloy: 16 to 42 (no change)
Seamless tubing lead times (weeks):
Domestic:
Carbon: 6 to 26 (no change)
Stainless: 8 to 26 (no change)
Nickel Alloy: 8 to 18 (no change)
*Lead times are accurate if hollows are in stock. If not, lead times can increase to 44 weeks as most hollows are of foreign melt.*
At Ward, our focus remains clear… Delivering high-quality equipment and projects on time while providing an exceptional fabrication experience. We’re committed to transparency, collaboration, and smart solutions in the face of evolving market conditions. As always, we want to work through these challenges together, so let us know your thoughts. Please don’t hesitate to reach out if you have any questions about the current state of our industry’s material supply chain.
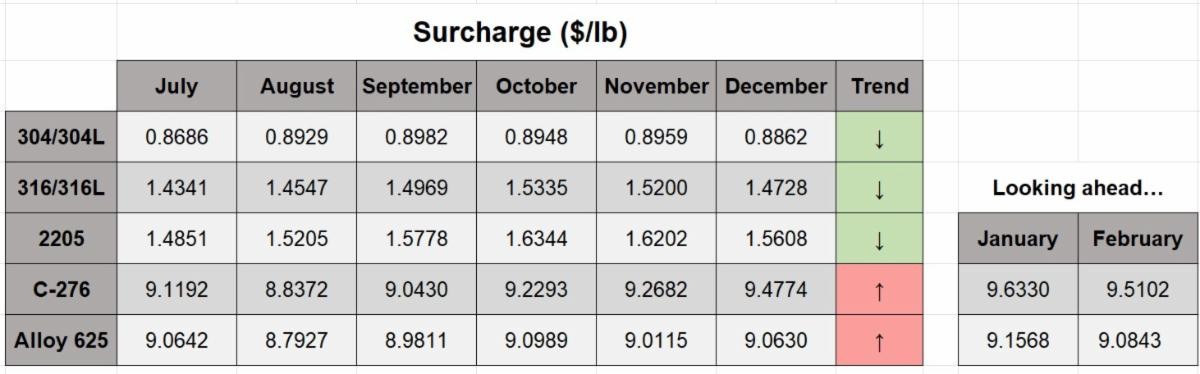
Nickel Prices have had an interesting ride over the past three decades, with a low of $2.20/lb. in October 2001 (following the September 11 events) and a high of $23.72/lb. in May 2007. Surcharges trail Nickel prices by approximately two months, so they would have been at their lowest in December 2001 (304 was $0.0182/lb.) and peak in July 2007 (304 was $2.2839/lb.).