The ISM Manufacturing PMI registered 50.9 percent in January, 1.6 percentage points higher compared to 49.3 percent recorded in December. The overall economy continued in expansion for the 57th month after one month of contraction in April 2020. (Important data points reference: A Manufacturing PMI reading above 50 percent indicates that the manufacturing economy is generally expanding; below 50 percent indicates that it is generally declining. A Manufacturing PMI above 42.5 percent, over a period of time, indicates that the overall economy, or gross domestic product (GDP), is generally expanding; below 42.5 percent, it is generally declining. The distance from 50 percent or 42.5 percent is indicative of the extent of the expansion or decline.)
The Conference Board Consumer Confidence Index declined by 0.6 points in January to 104.1 (1985=100).
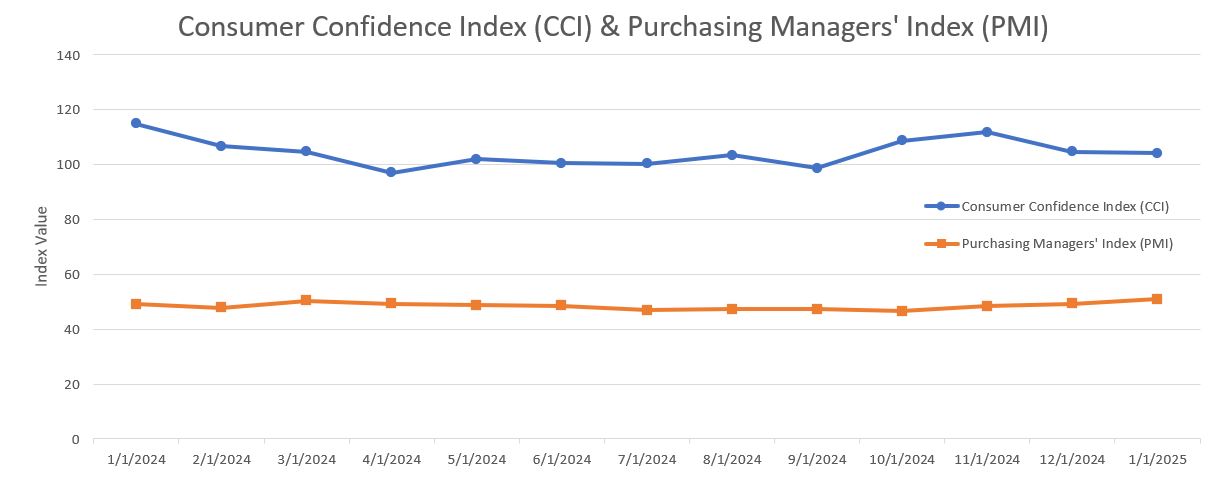
The Present Situation Index—based on consumers’ assessments of current business and labor market conditions—fell sharply in January, dropping 9.7 points to 134.3.
The Expectations Index—based on consumers’ short-term outlook for income, business, and labor market conditions—fell 2.6 points to 83.9, but remained above the threshold of 80 that usually signals a recession ahead.
The cutoff date for preliminary results was January 20, 2025.
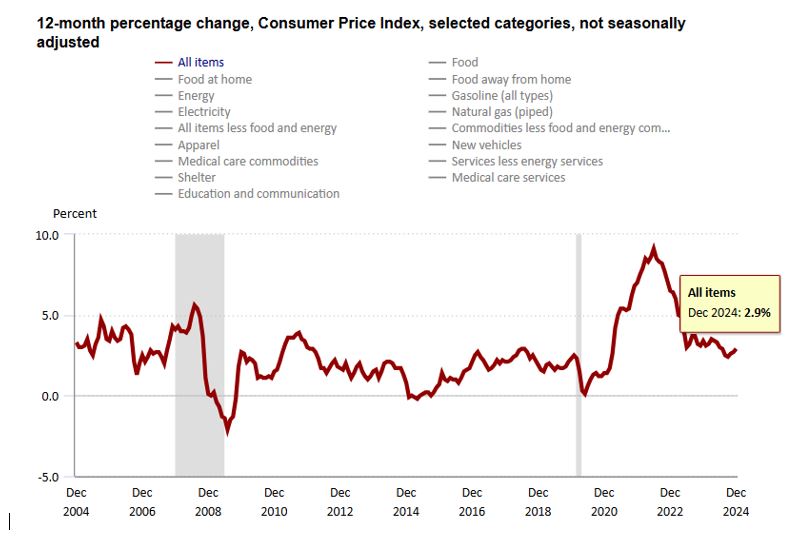
The Consumer Price Index (CPI, otherwise known as our “inflation” friend) is currently at 2.9% as of December 2024, up from 2.7% in November 2024. CPI tracks the rate of change in US inflation over time and the following shows the trends over the past 20 years.
WTI Crude Oil is heading for a third consecutive weekly decline after President Trump reaffirmed plans to boost US oil production to lower crude prices. His pledge came amid concerns over an elevated supply, following a sharper-than-expected rise in US oil stockpiles—the largest build in nearly a year. Limiting further losses, the US ramped up sanctions on Iran early in the week, potentially restricting its oil flows. At the same time, Saudi Aramco sharply raised March crude prices, driven by rising demand from China and India, along with supply disruptions from Russia. Meanwhile, US-China trade tensions persisted as Beijing imposed tariffs on American oil, LNG, and coal in response to Trump’s recent measures, though the impact is expected to be limited given China’s modest imports of US energy products.
WTI Crude Oil Pricing (per barrel):
Jan. 2nd: $73.130
Jan. 13th: $78.820 (monthly high)
Jan. 31st: $72.530 (monthly low)
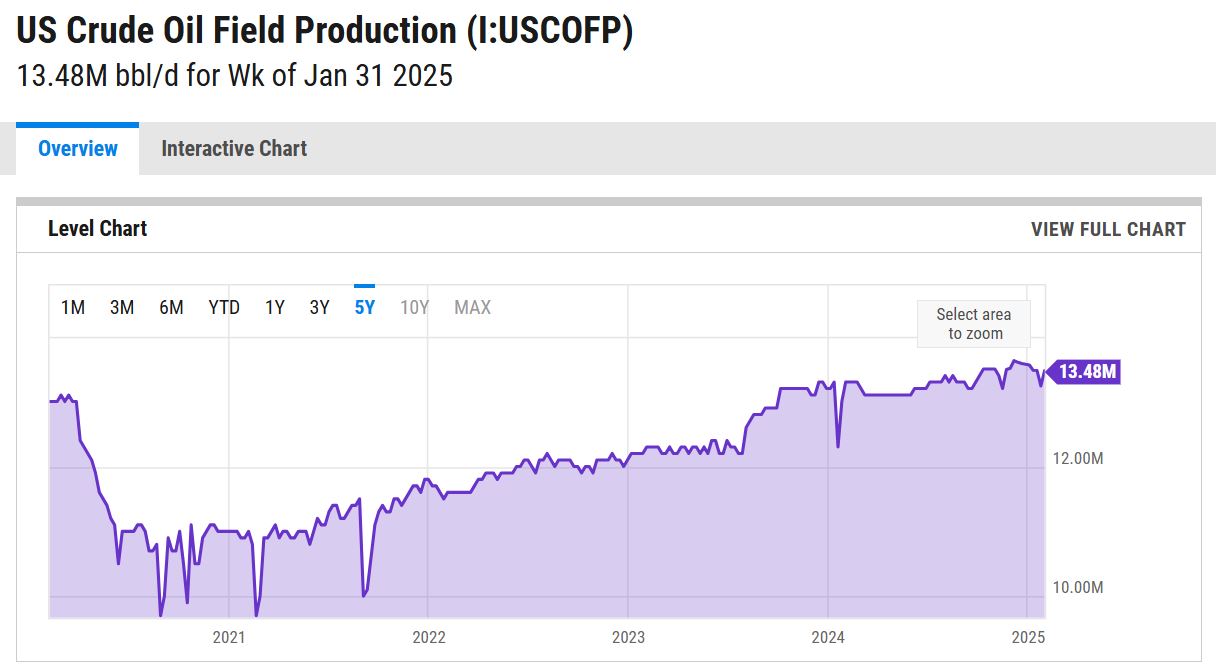
The online US Oil Rig Count is currently reported as 586 which is ? 3 compared to last month’s report and ? 37 from February 9 of 2024. This key and leading indicator shows the current demand for products used in drilling, completing, producing, and processing hydrocarbons which all of us use every day as fuel sources and finished products.
The number of rigs conducting oil and gas drilling in the United States continues to remain stagnant but efficiency has increased a lot over the years, as you can see from the chart below. We are now drilling at record production levels. This trend of fewer rigs however still reflects the priority of drillers to focus on efficiency and enhancing shareholder returns rather than expanding production through capital investments due to the previous administration’s desire to move away from fossil fuels. This philosophy might be changing now that the Trump administration is fully behind fossil fuels. To provide context, in 2019, 954 rigs were drilling for oil and gas in the US, and, in 2014, there were 1609 rigs before oil prices dropped below $20 per barrel at the end of that year.
However, solid oil prices will likely prevent the rig count from decreasing significantly, possibly leading to a rebound in 2025 with a new more oil-friendly administration in office (Drill, baby, drill!). Currently, the West Texas Intermediate benchmark prices have been at or around $75 per barrel, sufficient for most drillers to be profitable.
Nickel: Reports indicated that top producer Indonesia is considering policy to reduce nickel mining quotas to 150 million tons this year from 270 million tons in 2024, enough to reduce global supply by 35%. Still, the muted magnitude of the rebound indicate that markets expect the nickel market to remain in oversupply. This is due the surge of Chinese smelting projects in Indonesia after the latter prohibited the export of nickel ores in 2020. Indonesia was the host of 44 nickel smelting operations as of September, compared with four 10 years prior. Adding to the bearish pressure, new technology used by Chinese battery producers started to use technologies that refrain from using nickel, further denting the outlook for the metal.
Nickel Pricing (per pound):
Jan. 1st: $6.940
Jan. 2nd: $6.822 (monthly low)
Jan. 17th: $7.294 (monthly high)
Jan. 31st: $6.908
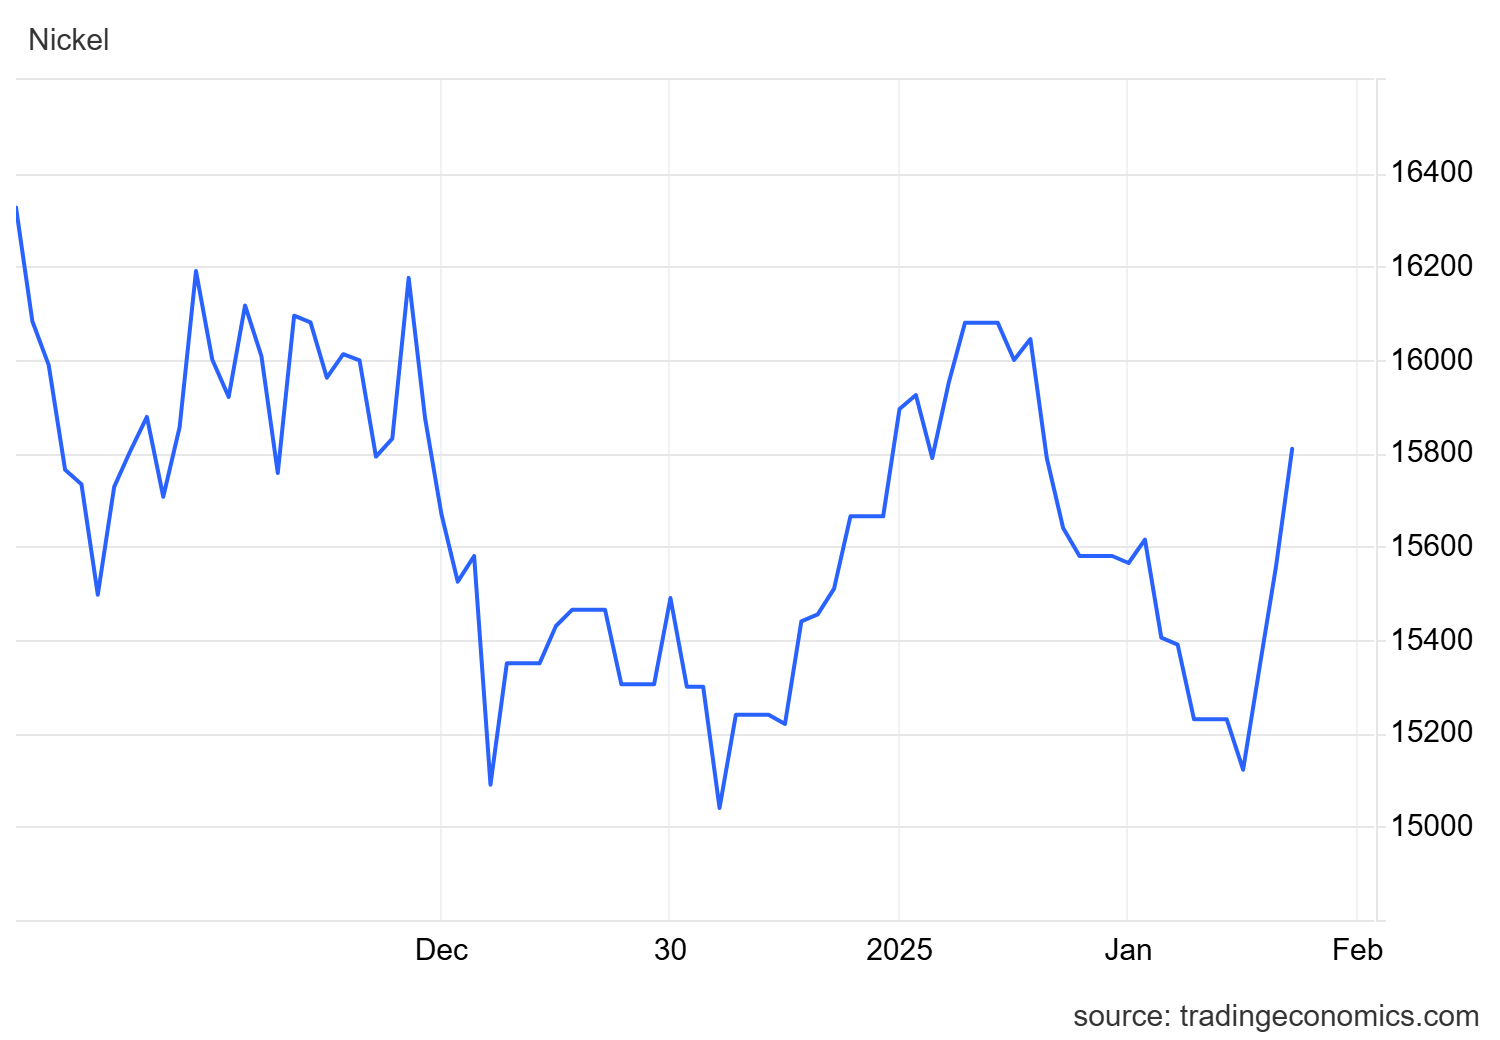
Below is the 90 day Nickel Price Trend (US$ per tonne).
Tariffs have tightened and will continue to evolve as the Trump administration reopens global negotiations after taking office. There’s a lot to unpack here so hold on for the ride.
As of February 2025, the Trump administration has implemented significant tariffs affecting global trade dynamics. On February 1, 2025, President Trump announced a 25% tariff on imports from Canada and Mexico, and a 10% tariff on imports from China (in addition to the 25% tariffs in prior place, bringing the total tariff rate on many products to 35%). These current measures are intended to address issues related to illegal immigration and drug trafficking, unlike the original 25% on China that are in place due to antidumping policies to help protect our industries from unfair low prices. However, the tariffs on Canada and Mexico have been temporarily paused for 30 days following negotiations. The Chinese tariffs are in place and China has announced retaliatory tariffs on U.S. goods, including a 15% tariff on coal and liquefied natural gas, and a 10% tariff on crude oil, agricultural machinery, and certain vehicles. These tariffs are expected to have widespread economic implications, and these developments are expected to have significant implications for global trade and could lead to increased costs for businesses and consumers in all countries.
On February 10, 2025, President Donald Trump announced the imposition of 25% tariffs on all steel and aluminum imports, effective March 4, 2025. This move reinstates and expands upon tariffs initially introduced in 2018, now applied universally without exceptions for allied nations such as Canada, Mexico, Japan, and South Korea.
For U.S.-based manufacturers of pressure vessels and heat exchangers, the impact of these tariffs will be interesting to see unfold and could be significant. Many of these manufacturers rely on imported raw materials and components. The imposed tariffs will lead to higher costs for these imports, potentially disrupting supply chains and increasing production expenses. Manufacturers will need to properly evaluate their supplier base to ensure they stay as competitive as possible.
While the tariffs may increase raw materials and components costs, they will also provide a much more competitive advantage for U.S.-based pressure vessel and heat exchanger manufacturers. The government effectively makes imported products more expensive by imposing tariffs on foreign-made pressure vessels and heat exchangers. This could lead to several potential benefits for domestic manufacturers: reduced foreign competition, increased market share, encouragement for domestic investment, potential price stabilization in our market, and a boost in government and industrial contracts. Overall, it boosts the purchase of American-made products, which, in our opinion, is good for American workers.
In summary, while the tariffs aim to help and protect domestic industries, they will pose challenges for U.S.-based pressure vessel and heat exchanger manufacturers by increasing operational costs and complicating supply chain logistics. However, the benefits can outweigh the drawbacks and will depend highly on how well domestic manufacturers adapt to increased material costs and whether demand shifts significantly in their favor. If manufacturers can efficiently manage costs and scale production, they could gain long-term advantages from the trade policies.
Domestic plate mill plate (PMP) – See below for mill production lead times (weeks):
Stainless: 5 to 8 (was 7 to 10)
Duplex: 7 to 9 (was 7 to 10)
Nickel Alloys: 7 to 14 (was 8 to 13)
Carbon steel: 5 to 8 (no change)
*Keep in mind, some plates will exceed the estimated ranges depending on the mill’s production schedule and slab availability.*
Domestic and Import Welded tubing – See below for mill production lead times (weeks):
Domestic:
Carbon: 6 to 8 (no change)
Stainless: 8 to 12 (no change)
Nickel Alloy: 12 to 14 (no change)
Import:
Carbon: 14 to 25 (no change)
Stainless: 16 to 30 (no change)
Nickel Alloy: 16 to 42 (no change)
Domestic Seamless tubing – See below for mill production lead times (weeks):
Carbon: 6 to 26 (no change)
Stainless: 8 to 26 (no change)
Nickel Alloy: 8 to 12 (no change)
*Lead times are accurate if hollows are in stock. If not, lead times can increase to 44 week as most hollows are of foreign melt.*
Please don’t hesitate to reach out if you have any questions about the current state of our industry’s material supply chain.
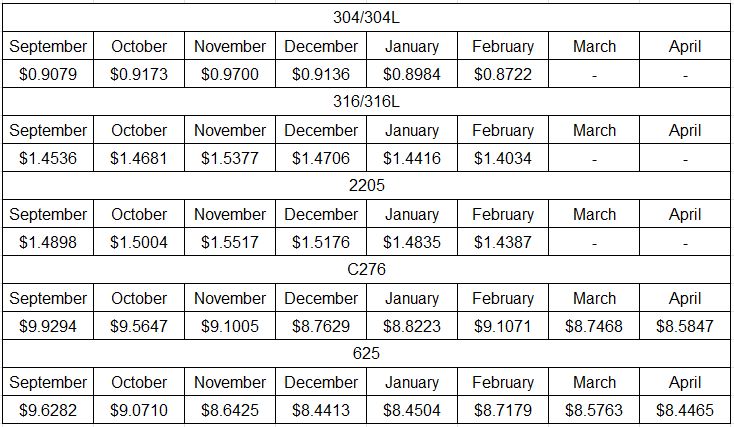
Here’s the current surcharge chart for 304/304LSS, 316/316LSS, 2205, C276, and 625.
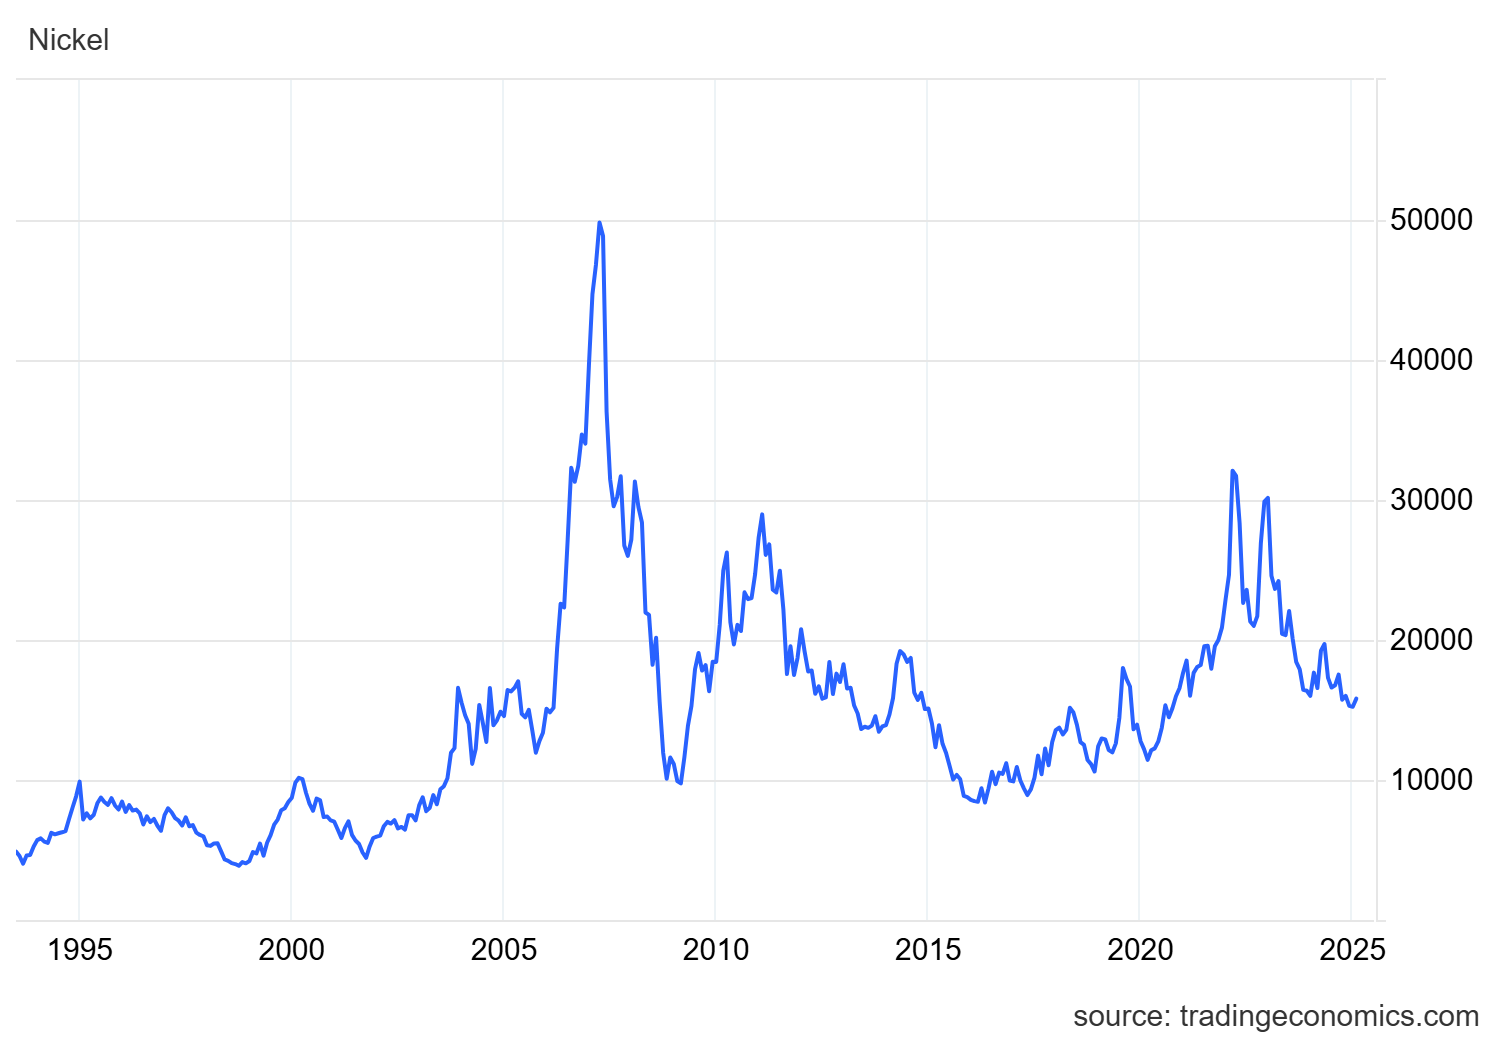
Nickel Prices have had an interesting ride over the past two decades with a low of $2.20/lb. in October of 2001 (following September 11 events) and a high of $23.72/lb. in May of 2007. Surcharges trail Nickel prices by approximately two months, so they would have been at their lowest in December of 2001 (304 was $0.0182/lb.) with the peak in July of 2007 (304 was $2.2839/lb.).
The chart below illustrates Nickel price by way of U.S. Dollars per Metric ton.
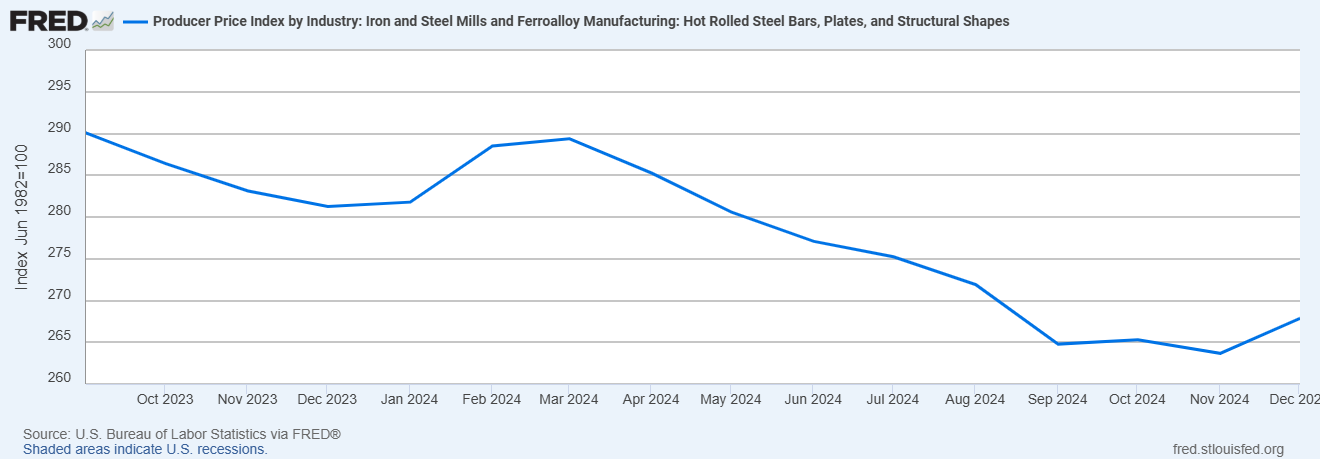
Here’s the Price Index for Hot Rolled Bars, Plate, and Structural Shapes.