Economic activity in the manufacturing sector expanded in January for the first time in 12 months, preceded by 26 straight months of contraction, say the nation’s supply executives in the latest ISM® Manufacturing PMI® Report.
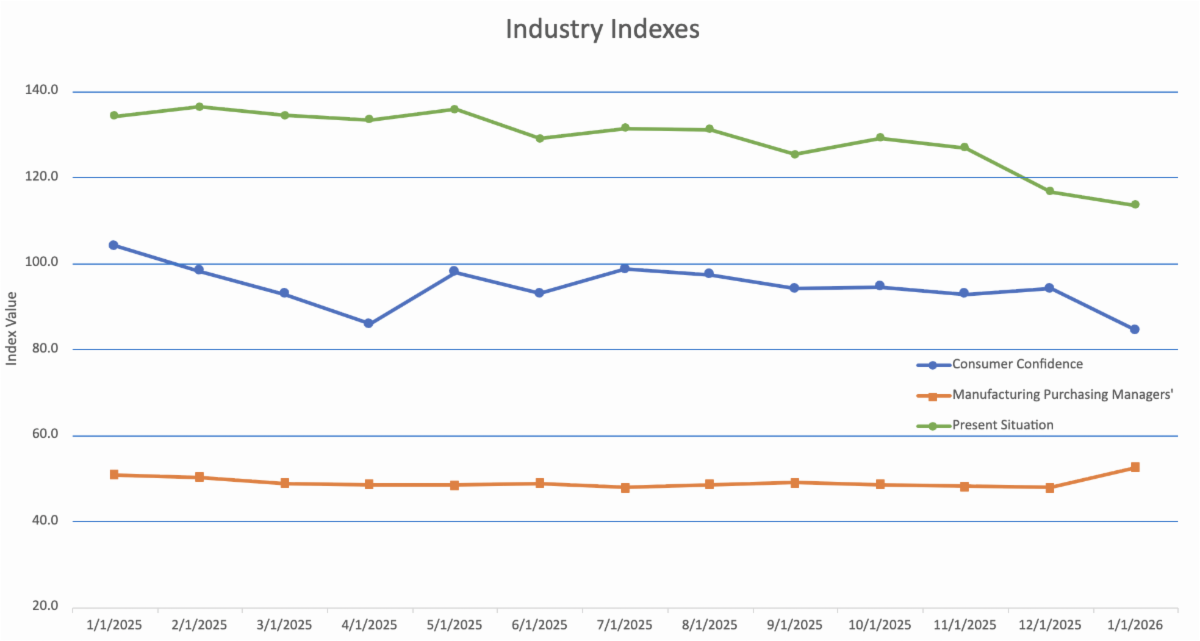
The Manufacturing PMI® registered 52.6 percent in January, a 4.7-percentage point increase compared to the seasonally adjusted reading of 47.9 percent in December. The overall economy continued in expansion for the 15th month. (Important data point reference: A Manufacturing PMI reading above 50 percent indicates that the manufacturing economy is generally expanding; below 50 percent indicates that it is generally contracting. A Manufacturing PMI above 47.5 percent, over a period of time, indicates that the overall economy, or gross domestic product (GDP), is generally expanding; below 47.5 percent, it is generally contracting. The distance from 50 percent or 47.5 percent is indicative of the extent of the expansion or contraction.)
The Conference Board Consumer Confidence Index® fell by 9.7 points in January to 84.5 (1985=100), from an upwardly revised 94.2 in December. A 5.1-point upward revision to December’s reading of the Index resulted in a slight increase last month, reversing the initially reported decline. However, January’s preliminary results showed confidence resumed declining after a one-month uptick.
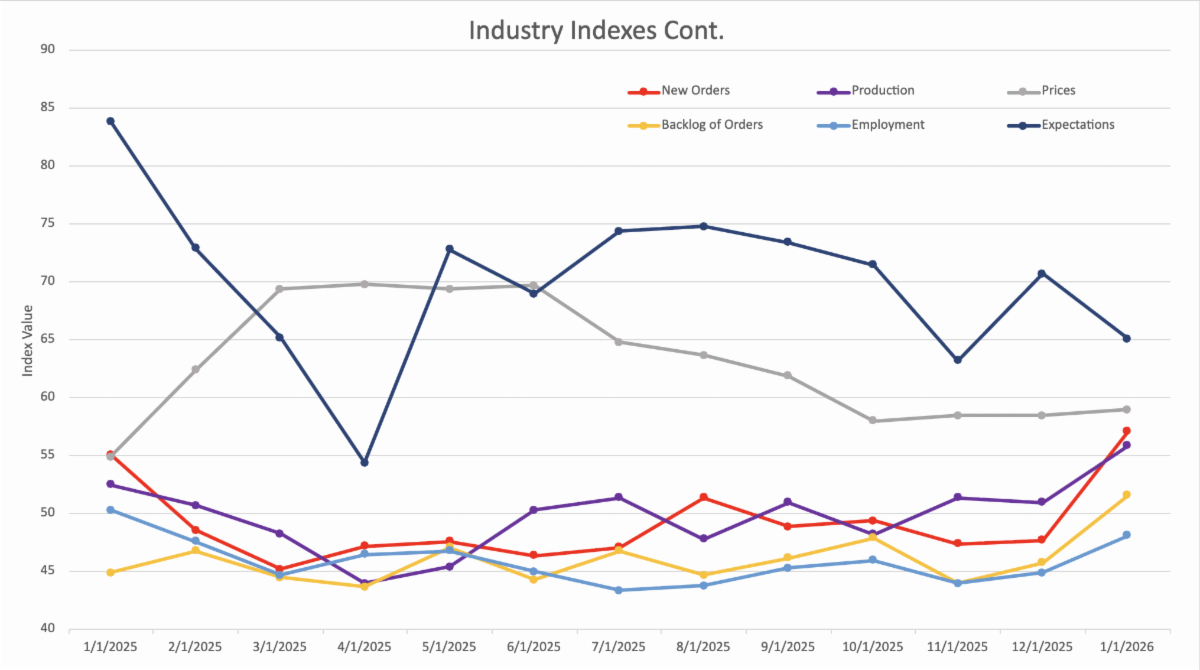
Please see the graphs for other notable indexes related to our industry.
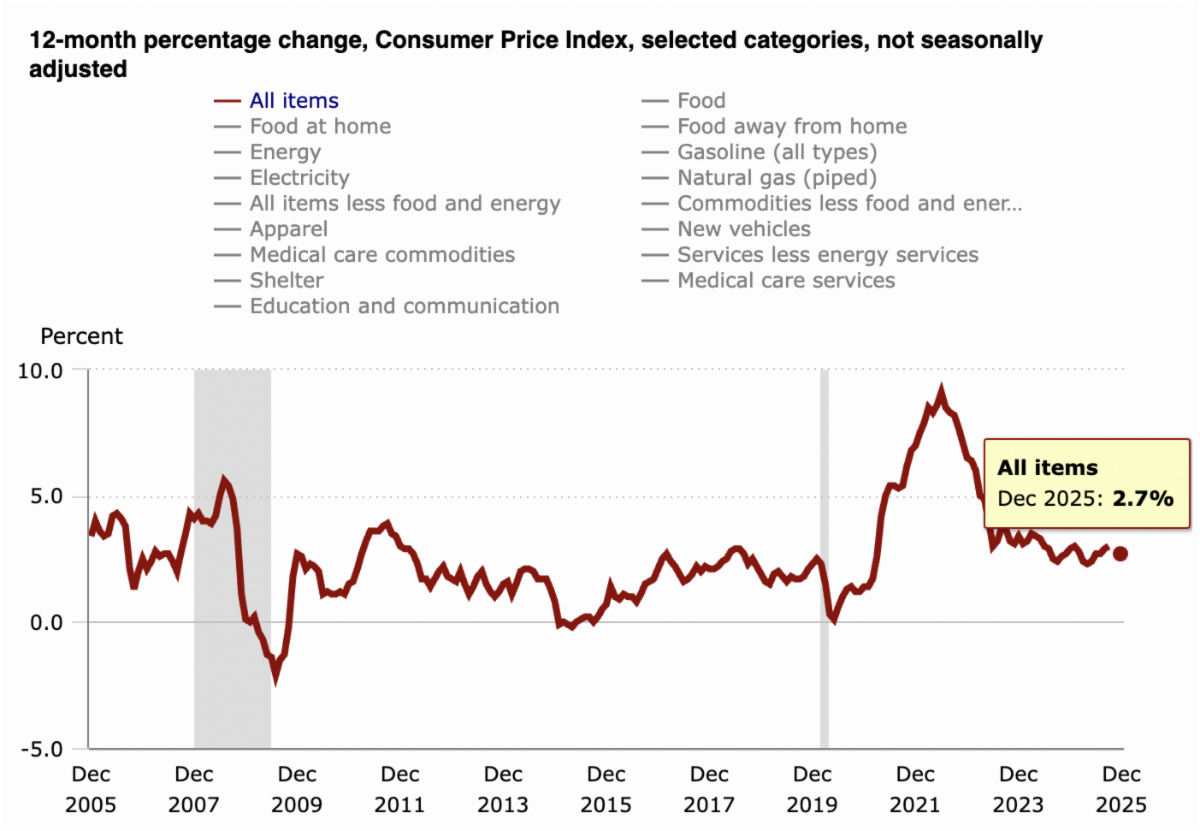
The Consumer Price Index (CPI, otherwise known as our “inflation” friend) is currently at 2.7% as of December 2025, the same as in November 2025. CPI tracks the rate of change in US inflation over time, and the following shows the trends over the past 20 years.
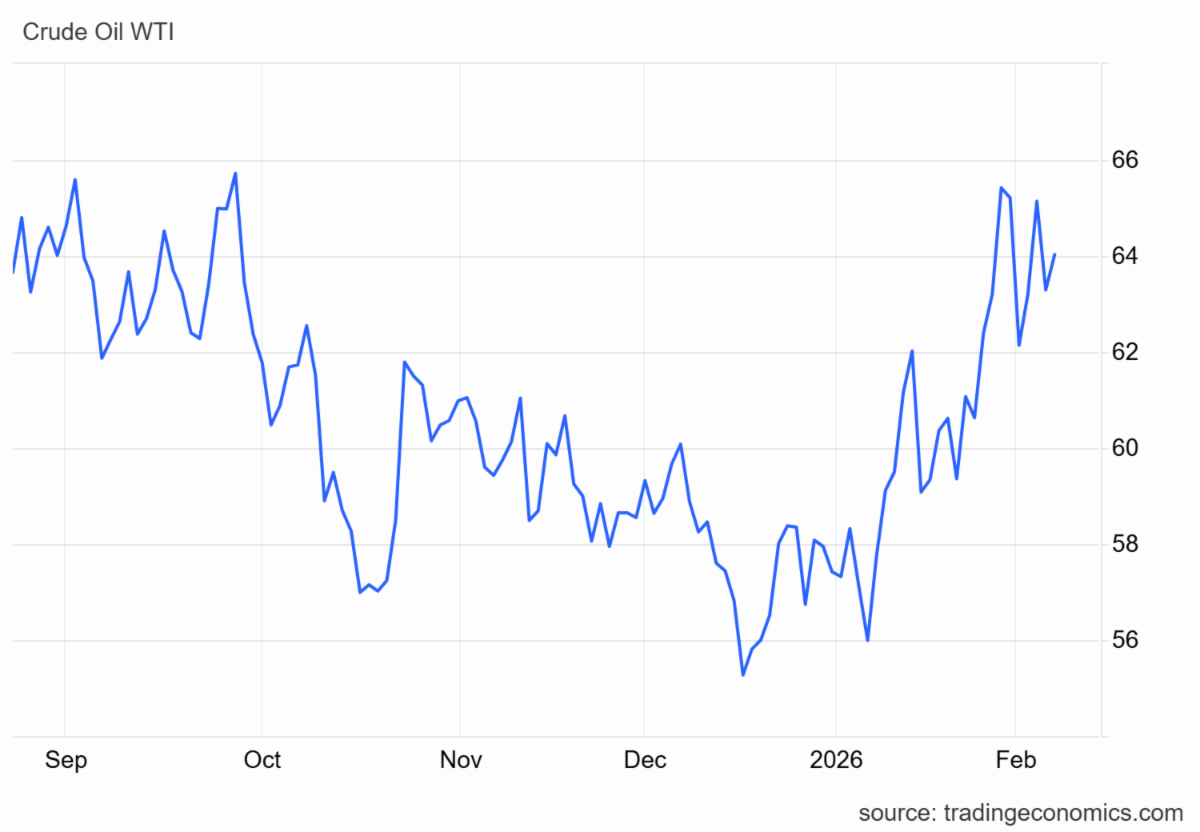
WTI crude futures traded choppily on Friday, dipping earlier on easing Middle East risk before rebounding over 0.5% to trade close to $63.7 a barrel, though prices remained on track for a first weekly decline in seven weeks. US-Iran nuclear talks in Oman, which Iranian officials described as a good start with plans to continue negotiations, reduced fears of near-term supply disruptions from a region that accounts for roughly one third of global crude output. Earlier gains reflected lingering caution as the US sought to broaden talks beyond nuclear issues, while prior evacuation advisories had heightened sensitivity to the risk of escalation. That premium faded as diplomatic signals improved, reinforcing expectations of oversupply later this year. Adding to pressure, Saudi Arabia cut official selling prices for its main crude grade to Asia to the lowest since late 2020, highlighting ample supply, though the smaller than expected reduction suggested confidence in demand.
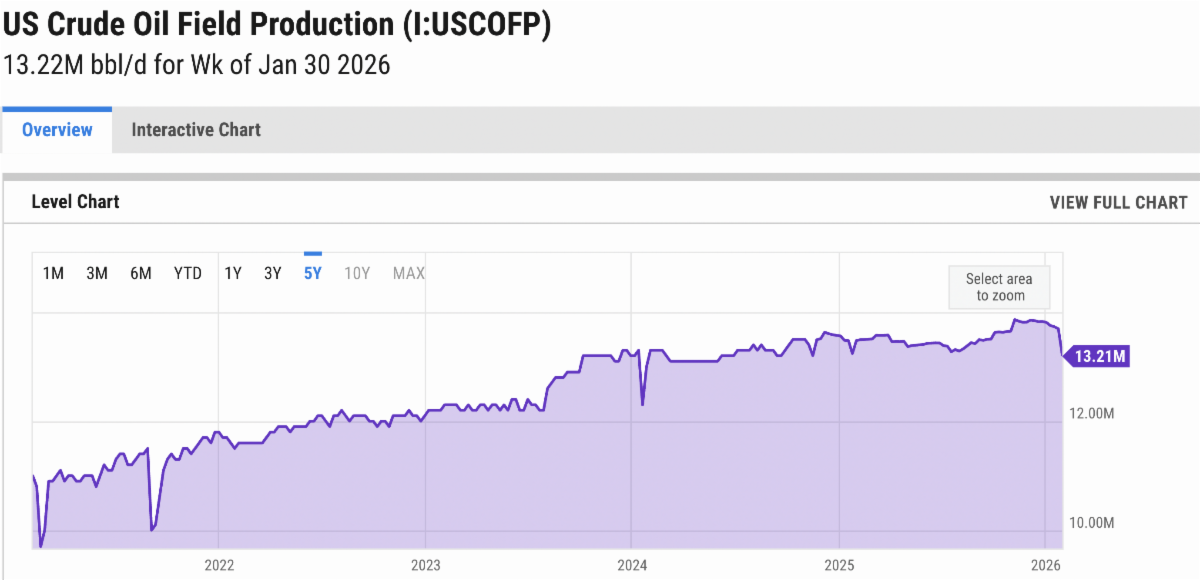
The online US Oil Rig Count is currently reported as 551, which is up 6 compared to last month’s report and down 35 from January 10, 2025. This key and leading indicator shows the current demand for products used in drilling, completing, producing, and processing hydrocarbons, which we all use every day as fuel sources and finished products.
The number of rigs conducting oil and gas drilling in the United States remains stagnant, but efficiency has increased significantly over the years, as shown in the chart below. We are drilling at or near record production levels. However, this trend of fewer rigs still reflects the priority of drillers to focus on efficiency and enhancing shareholder returns rather than expanding production through capital investments due to the previous administration’s desire to move away from fossil fuels. This philosophy might change now that the Trump administration is entirely behind fossil fuels. To provide context, in 2019, 954 rigs were drilling for oil and gas in the US, and, in 2014, there were 1609 rigs before oil prices dropped below $20 per barrel at the end of that year.
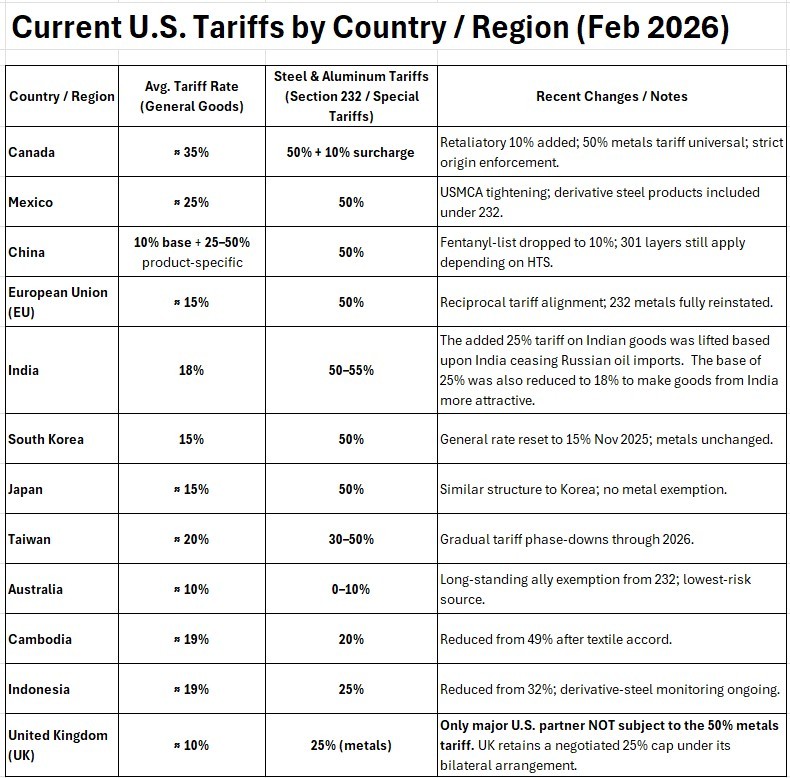
Tariffs have tightened, untightened, and will continue to evolve as the Trump administration navigates global negotiations.
Whew… There’s A LOT to unpack here, so hold on for the roller coaster ride.
A little background on where all of this started and what it means. Tariffs are duties placed on foreign goods, paid by domestic importers to Customs and Border Patrol at ports of entry. President Trump introduced tariffs on select Chinese goods in his first term back in 2018, which President Joe Biden later maintained, along with duties on steel and aluminum from most countries. In February of 2025, Trump reinstated tariffs—10% more on Chinese imports, bringing them to 35%, and 25% on Mexican and Canadian goods (except for oil, taxed at 10%).
As of February 10, 2026, at 11 am EST, U.S. tariff policy remains in flux but is trending tighter across broad categories, with several fast-moving legal and policy developments.
Reciprocal tariffs face legal trouble. On Aug. 29, 2025, the U.S. Court of Appeals for the Federal Circuit held that most of the Trump Administration’s “reciprocal tariffs” exceeded presidential authority under IEEPA. The administration seeks Supreme Court review; portions remain in effect pending further proceedings and agency guidance. Here is the timeline of this important ruling. The Supreme Court heard the oral arguments on November 5, 2025. Justices expressed skepticism about using an “emergency” statute for a sweeping tariff program. Several questioned whether tariffs are effectively taxes requiring explicit congressional approval.
FEB / JUN 2026 – Expected ruling timeframe
Possible outcomes:
- Court overturns the tariffs (most expected). Importers may receive refunds; IEEPA cannot be used to impose reciprocal tariffs.
- Court upholds the tariffs (less likely). Sweeping tariff authority under IEEPA remains intact.
- Middle position. Tariffs allowed only in a narrowly limited form; future use constrained.
De minimis is still suspended and gone for now. The long-standing duty-free threshold for shipments under $800 was terminated on Aug. 29, 2025 by executive action. International small-parcel flows fell by ~80% immediately after, as posts and carriers scrambled to comply; duties/fees now apply to those packages.
Metal tariffs widened and deepened. Section 232 steel/aluminum tariffs (now 50% in most cases) were expanded to cover hundreds of additional steel- and aluminum-containing products, straining the U.S.–EU truce and imposing additional burdens on origin tracing for importers.
What does this mean for U.S. pressure vessel and heat exchanger manufacturers?
Price pressure on imports – Expanded metals coverage and higher headline rates raise costs for imported plate, tube, fittings, and subassemblies, especially where origin tracing is complex.
Competitive tailwind – As soon as all of the proper harmonized tariff schedule codes for manufacturers are approved by the Commerce Department. Most of these actions are currently on hold pending the Supreme Court ruling mentioned above. Higher landed costs on foreign vessels and exchangers reduce price undercutting in bids, supporting the U.S. share in industrial and government contracts (Inference from current tariff structure and coverage). Make sure your House and Senate representatives hear your voice and concerns so we’re all properly protected.
Procurement and compliance load – With de minimis gone and derivative-product rules widening, expect more broker work, HTS reclassifications, certificates of origin, and tighter vendor audits, particularly on mixed-origin fabrications.
Volatility risk – The legal overhang on reciprocal tariffs plus ongoing executive adjustments means terms can change quickly; quote validity windows and escalation clauses matter more now.
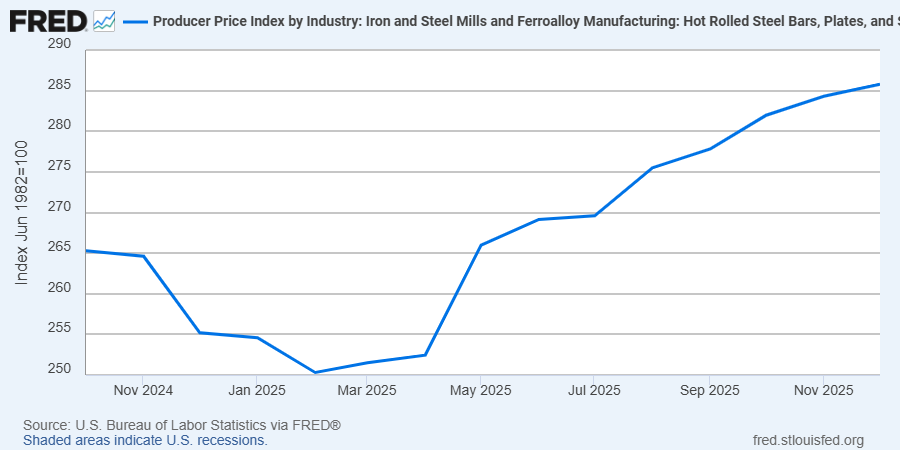
Bottom line: Tariffs currently favor domestic steel suppliers by lifting competitors’ U.S. price floors, but they also raise input and compliance costs for manufacturers, many of whom are waiting for approval for their various harmonized tariff schedule codes. Shops that lock in domestic steel where feasible, tighten origin documentation, and build flexible pricing into quotes are best positioned to capture the demand shift while managing volatility.
How does this affect your pricing for pressure vessels and heat exchangers?
At Ward, we purchase 80-90% domestically, depending upon the project. This means our total material spend has increased by approximately 5-15% since the tariffs were enacted, resulting in a 3-10% overall unit price increase after labor is factored in. We are doing our part to support American manufacturing while keeping our pricing as competitive as possible.
The administration has published several tariff fact sheets on the White House website (click here) as the tariff topic has evolved.
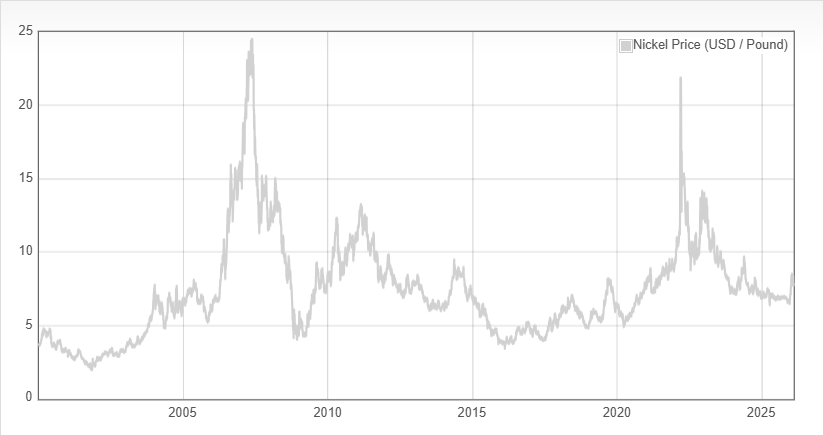
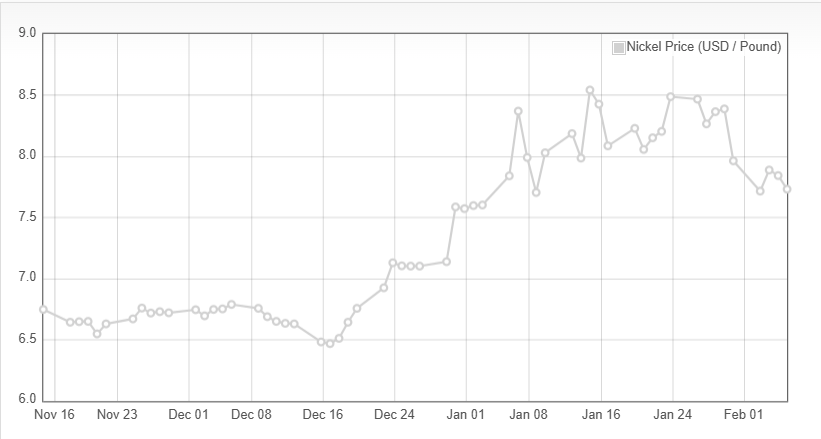
Nickel futures in the UK sank to $7.711 per pound, extending the plunge from the 19-month high of $8.618 tested through January, aligned with the drop in other base metals as investors reconsidered speculative positions in commodities. Still, contracts remained sharply higher from the average of last year on the risk of lower supply. Jakarta confirmed it will cut mining permits to 260 million wet tons of tin ore this year compared to 379 million tons in the previous year, removing a significant source of global supply as electrification and datacenter demand surge across major economies. However, the ambiguity on production around a cap on wet tons allowed some flexibility on production for miners, while the lack of reporting on production levels for major producers in the country limited the outlook of lower supply. This is despite Indonesia’s effort to crack down on illegal mining activities.
Plate mill plate lead times (weeks):
Domestic:
Stainless & Duplex: 6 to 8 (previously 5 to 7)
Nickel Alloys: 6 to 13 (previously 6 to 11)
Carbon steel: 6 to 8 (no change)
*Keep in mind, some plates will exceed the estimated ranges depending on the mill’s production schedule and slab availability. *
Welded tubing lead times (weeks):
Domestic:
Carbon: 6 to 16 (no change)
Stainless: 8 to 15 (no change)
Nickel Alloy: 8 to 18 (no change)
Import:
Carbon: 14 to 25 (no change)
Stainless: 16 to 30 (no change)
Nickel Alloy: 16 to 42 (no change)
Seamless tubing lead times (weeks):
Domestic:
Carbon: 6 to 26 (no change)
Stainless: 8 to 26 (no change)
Nickel Alloy: 8 to 18 (no change)
*Lead times are accurate if hollows are in stock. If not, lead times can increase to 44 weeks as most hollows are of foreign melt. *
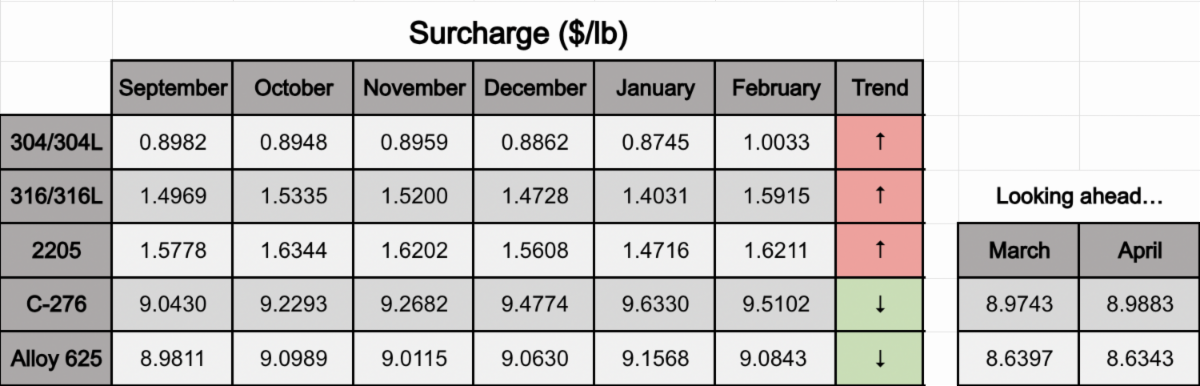
Nickel Prices have had an interesting ride over the past three decades, with a low of $2.20/lb. in October 2001 (following the September 11 events) and a high of $23.72/lb. in May 2007. Surcharges trail Nickel prices by approximately two months, so they would have been at their lowest in December 2001 (304 was $0.0182/lb.) and peak in July 2007 (304 was $2.2839/lb.).