The ISM Manufacturing Index (PMI) slipped a bit in January, declining from December’s 58.8 mark to a reading of 57.6. This still marks the 20th consecutive month of expansion in the overall economy. Notably, January was the third month in a row with indications of improvement in labor availability and supplier delivery performance. The other side of that coin reveals continued challenges with logistics, COVID-related work stoppages, and occasional key material shortages. All said, sentiment remains very optimistic for manufacturing in the short and medium term.
January saw Consumer Confidence slightly dip to 113.8 from December’s 115.2 mark. The American public remains concerned about inflation and COVID, but they aren’t letting either factor derail spending. Even without continued government stimulus, many consumers are still planning to purchase durable goods in the coming months – indicating that growth should remain moderate at least.
Registering the highest prices since 2014, WTI Oil ended January at $88.15 per barrel, steadily marching up all month from a starting point of $76.08 per barrel. The oil market looks to remain at the current price point, if not higher, as a result of low inventories, low spare capacity, and low investment. Disruptions in production from Russia or OPEC could very well send prices well over the $100 per barrel mark.
The online US Oil Rig Count is at 613 which is up 27 compared to last month’s report and up 221 from February 5 of 2021 (high of 1609 in October of 2014 before oil pricing dropped below $20 per barrel at the end of that year). This key and leading indicator shows the current demand for products used in drilling, completing, producing, and processing of hydrocarbons which all of us use every day as fuel sources and finished products.
Nickel continued to rise in January, escalating from $9.57/lb. at the start of the month to land at $10.14/lb. when the month closed. Nickel averaged $10.13/lb. for January, a decided increase from December’s $9.10/lb. average price. Dwindling inventories and steady EV growth continues to put upward pressure on the commodity.
Below is the 90 day Nickel Price Trend (US$ per tonne).

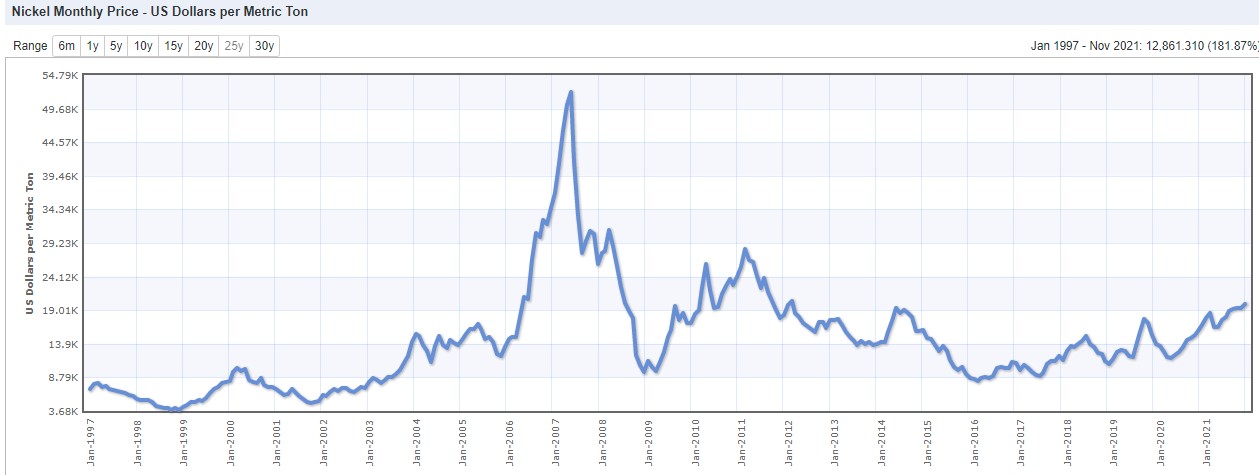
Nickel Prices have had an interesting ride over the past two decades with a low of $2.20/lb. in October of 2001 (following September 11 events) and a high of $23.72/lb. in May of 2007. Surcharges trail Nickel prices by approximately two months, so they would have been at their lowest in December of 2001 (304 was $0.0182/lb.) with the peak in July of 2007 (304 was $2.2839/lb.).
The chart below illustrates Nickel price by way of U.S. Dollar per Metric ton.

Domestic steel mills stayed put in January, electing to keep prices steady. Indications continue to point to carbon steel prices being under downward pressure as 2022 progresses.
Commodity stainless and Duplex plate deliveries remain in the 7 to 10 week range, while Nickel alloy plate is still mired in the 10 to 20 week range. The nickel alloy plate delivery schedules continue to be impacted by the ongoing labor strike at Special Metals in Huntington, WV. Carbon Steel plate mill deliveries continue to remain in the 8 to 12 week delivery range.
Welded tubing –Stainless strip supply continues to slowly improve, allowing for some deliveries in the 10 to 16 week range, although potentially more economical options are in the window of 18 to 24 weeks. Carbon steel tubing deliveries have lead times ranging anywhere from 8 to 12 weeks when strip is available.
Seamless tubing – Current schedules now reflect 8 to 16 weeks for carbon steel and 12 to 23 weeks for stainless. Seamless nickel tubing is being offered at the 10 to 12 week delivery window so long as hollows are in stock. If hollows are not readily available, anticipate deliveries of seamless nickel tubing in the 20 to 32 week timeframe.
The metal market is still in a tremendous state of uncertainty and price volatility, so please don’t hesitate to reach out if you have any questions.
Here’s the current surcharge chart for 304/304LSS, 316/316LSS, 2205, C276, and 625.


