In December 2023, the ISM Manufacturing Index (PMI) showed a slight improvement, rising to 47.4 compared to November’s 46.7, surpassing the anticipated 47.1 forecast. Despite this, the data indicated the 14th consecutive month of contraction in factory activity, marking the longest period of decline since 2000-2001 (i.e. a PMI reading above 50 means expansion, while below 50 means contraction). While production saw a rebound (50.3 vs 48.5), new orders (47.1 vs 48.3), employment (48.1 vs 45.8), and inventories (44.3 vs 44.8) continued to shrink. Additionally, there was a decrease in price pressures (45.2 vs 49.9) due to soft energy markets offsetting increases in the steel and aluminum sectors. On a positive note, the Supplier Deliveries Index increased (47 vs 46.2), and manufacturing supplier lead times continued to decrease, signaling potential positive developments for future economic activity.
In December, the Conference Board Consumer Confidence Index saw an increase to 110.7 (1985=100), compared to a downwardly revised 101.0 in November. The Present Situation Index, reflecting consumers’ evaluations of current business and labor market conditions, increased to 148.5 (1985=100) from the previous month’s 136.5. Additionally, the Expectations Index, which gauges consumers’ short-term outlook on income, business, and labor market conditions, surged to 85.6 (1985=100) in December, up from the revised November figure of 77.4. This significant increase brings expectations back to the optimistic levels observed in July of the same year.
“December’s increase in consumer confidence reflected more positive ratings of current business conditions and job availability, as well as less pessimistic views of business, labor market, and personal income prospects over the next six months,” said Dana Peterson, Chief Economist at The Conference Board. “While December’s renewed optimism was seen across all ages and household income levels, the gains were largest among householders aged 35-54 and households with income levels of $125,000 and above. December’s write-in responses revealed the top issue affecting consumers remains rising prices in general, while politics, interest rates, and global conflicts all saw downticks as top concerns. Consumers’ Perceived Likelihood of a US Recession over the Next 12 Months abated in December to the lowest level seen this year—though two-thirds still perceive a downturn is possible in 2024.”
WTI Oil entered December at $74.250 per barrel. Prices fell to a monthly low of $68.850 per barrel on the 12th, then hit a monthly high of $75.570 per barrel on the 26th. Prices ticked down towards the end of the month, closing out 2023 at $71.650 per barrel. Distillate stockpiles rose by 10.1 million barrels, crushing estimates for a 400,000 barrel build, while crude inventories fell by 5.5 million barrels. Traders continued to monitor developments in Libya where protests halted production from the Sharara and El-Feel fields, which jointly contribute around 365,000 barrels per day. Escalating tensions in the Middle East continue to make traders uneasy. The U.S. Secretary of State Antony Blinken prepared a visit to the region aiming to prevent the further spread of conflict.
The online US Oil Rig Count is at 621 which is down 4 compared to last month’s report and down 151 from Jan 6 of 2023. This key and leading indicator shows the current demand for products used in drilling, completing, producing, and processing hydrocarbons which all of us use every day as fuel sources and finished products.
The number of rigs conducting oil and gas drilling in the United States continues to remain stagnant. This trend reflects the priority of drillers to focus on enhancing shareholder returns rather than expanding production coupled with the current administration’s desire to move away from fossil fuels. Additionally, uncertainty surrounds the economic outlook, leading the industry to remain cautious, especially compared to pre-pandemic times when the rig count showed a slower recovery over the past few years. To provide context, in 2019, 954 rigs were drilling for oil and gas in the U.S., and, in 2014, there were 1609 rigs before oil prices dropped below $20 per barrel at the end of that year.
However, solid oil prices will likely prevent the rig count from decreasing significantly and may even lead to a rebound in 2024. Currently, the West Texas Intermediate benchmark prices have been at around $75 per barrel, which is sufficient for most drillers to be profitable.
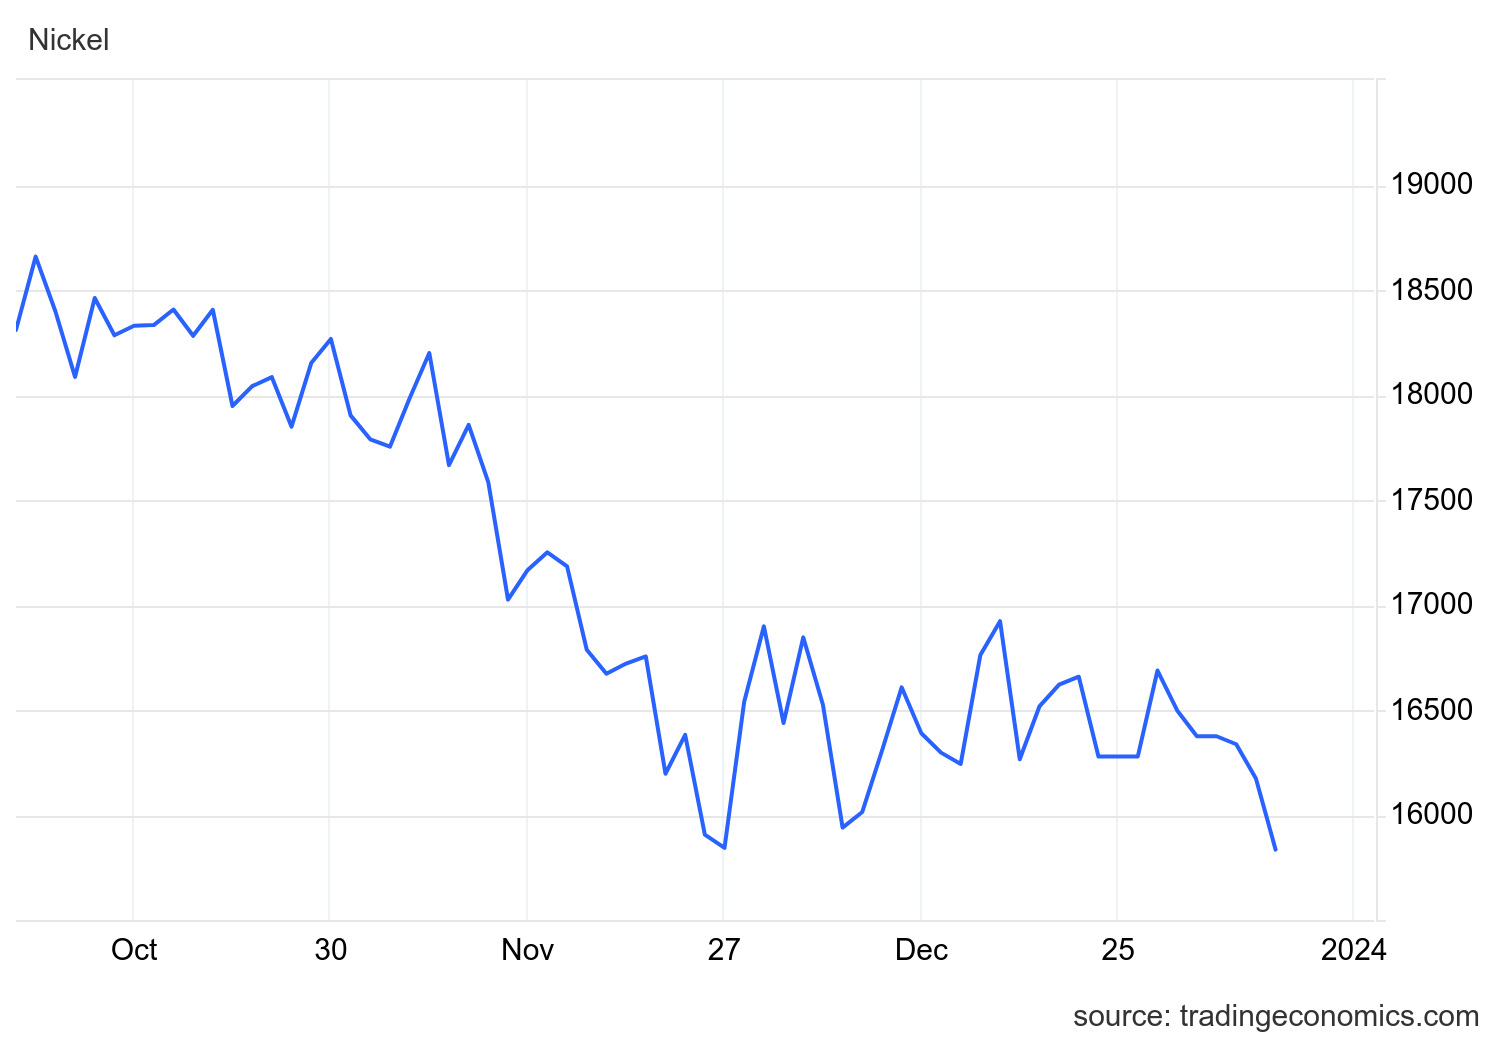
Nickel had minimal movement during December, starting the month at $7.641 per pound. We saw a monthly low on the 5th at $7.230 per pound, followed by a monthly high on the 15th at $7.676 per pound. Nickel closed out 2023 at $7.428 per pound. We are experiencing two-year lows which are not far from three-year lows, as robust supply from world’s leading producers (Indonesia, Philippines, and China) continued to weigh on the commodity. According to latest forecast by the International Nickel Study Group, the metal’s supply surpassed demand by 223,000 metric tons in 2023, and the gap is expected to widen to 239,000 metric tons in 2024. This comes from subdued use due to the global economic slowdown and a particularly fragile recovery in China. On the other hand, a slight relief for the prices comes from hopes of rate cuts by major central banks and stronger demand prospects (3.47 million tons vs 3.20 million in 2023) linked to growing usage of nickel in electric vehicle batteries and the revival of the stainless-steel sector. In 2023, nickel plunged by 45% becoming the worst performer across the nonferrous metals complex on LME.
Below is the 90 day Nickel Price Trend (US$ per tonne).

Commodity stainless plate deliveries have pulled in once again on certain grades and sizes to a 7 to 9 week range. Nickel alloy plates pulled into the 8 to 9 week range. Duplex plates are currently sitting in the 7 to 9 week range. Carbon steel plate mill deliveries are scheduled in the 6 to 10 week range. Nucor released a base price increase at the return of the Thanksgiving Holiday. This came shortly after a prior base price increase. Remember that some plates will exceed the estimated ranges depending on the mill’s production schedule with the upcoming holidays and planned shutdowns.
Welded tubing – Currently, deliveries for domestically welded stainless tubing are in the 6 to 12 week range, whether in small or large quantities (Up to 26 weeks for import). Carbon steel tubing deliveries have lead times ranging anywhere from 6 to 12 weeks when strip is available. Welded nickel alloy tubing ranges from 8 to 14 weeks (up to 42 weeks for imports). There has been a decrease across the board in tubing lead times as domestic and foreign mills are looking for more work.
Seamless tubing – Current schedules reflect 10 to 20 weeks or more for carbon steel (24 to 26 weeks for Western European carbon seamless) and 10 to 35 weeks for stainless. Seamless nickel tubing is being offered at the 10 to 14 week delivery window so long as hollows are in stock. If hollows are not readily available, anticipate deliveries of seamless nickel tubing in the 20 to 32 week timeframe.
Please don’t hesitate to reach out if you have any questions about the current state of our industry’s material supply chain.
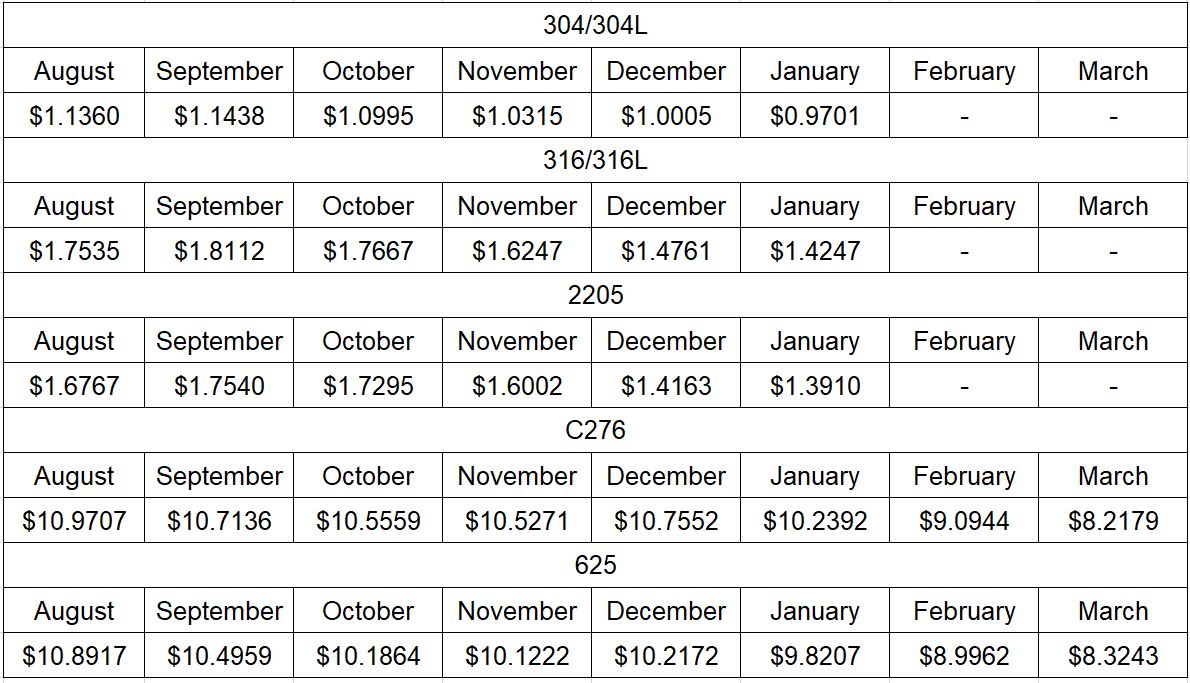
Here’s the current surcharge chart for 304/304LSS, 316/316LSS, 2205, C276, and 625.

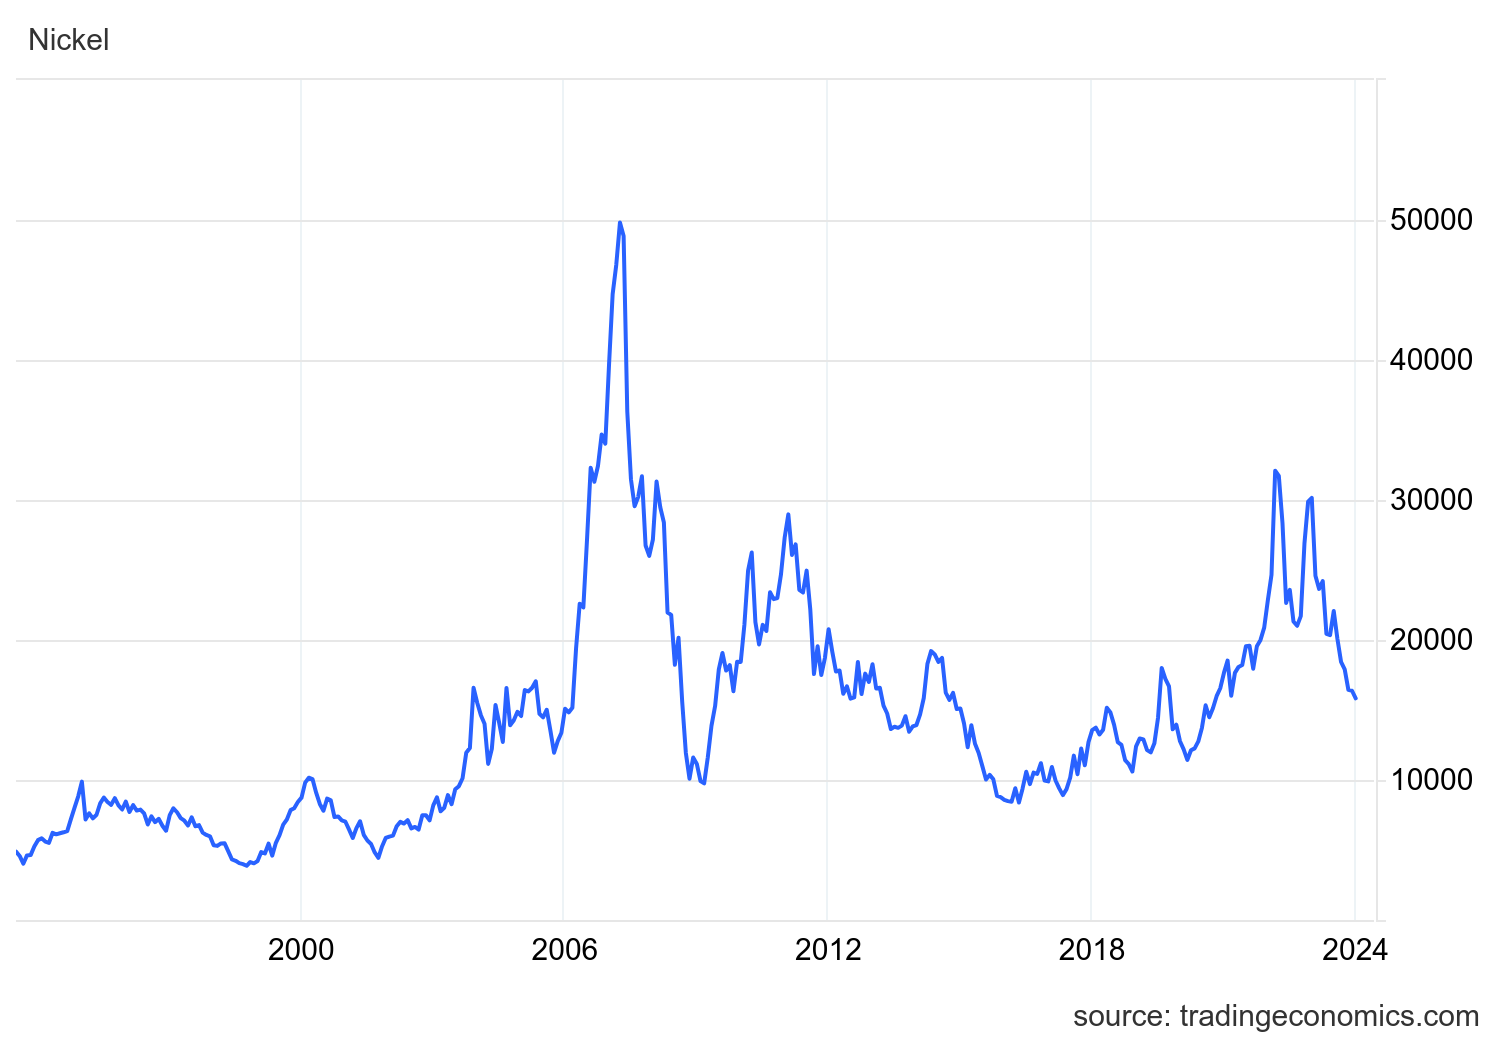
Nickel Prices have had an interesting ride over the past two decades with a low of $2.20/lb. in October of 2001 (following September 11 events) and a high of $23.72/lb. in May of 2007. Surcharges trail Nickel prices by approximately two months, so they would have been at their lowest in December of 2001 (304 was $0.0182/lb.) with the peak in July of 2007 (304 was $2.2839/lb.).
The chart below illustrates Nickel price by way of U.S. Dollars per Metric ton.

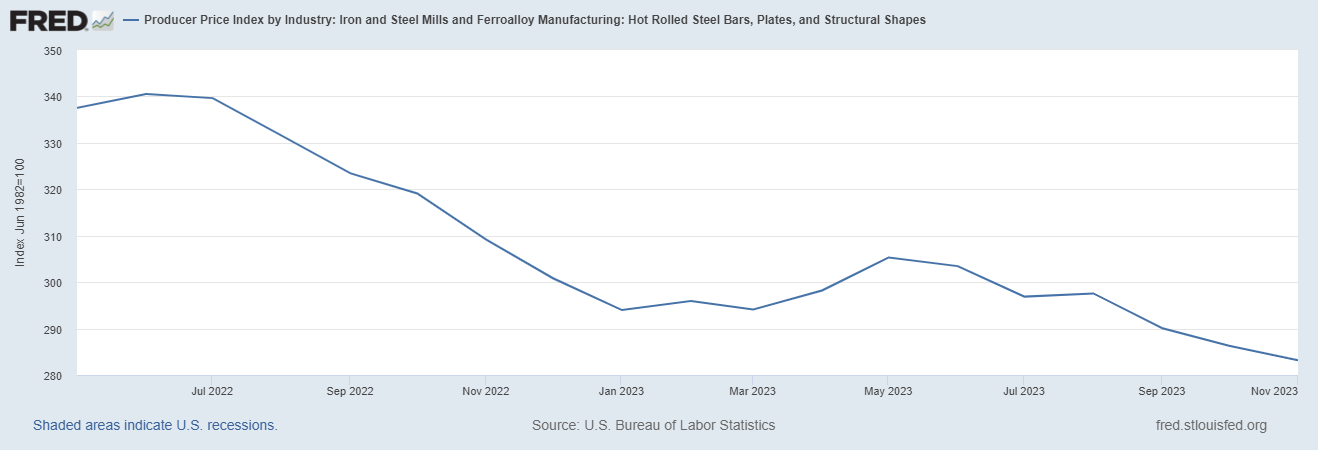
Here’s the Price Index for Hot Rolled Bars, Plate, and Structural Shapes.


