The ISM Manufacturing Index (PMI) for September 2023 showed a notable increase to 49, up from 47.6 the previous month. This exceeded market expectations set at 47.8 and indicated the US manufacturing sector’s slowest contraction in ten months. Despite this improvement, the data still highlighted almost a year of continuous monthly contractions in US factory activity, underscoring the influence of increased borrowing costs from the Federal Reserve on the sector. Despite experiencing a decline for the 13th consecutive month, new orders decreased at a significantly slower rate due to changes in the supply chain, prompting customers to initiate more projects. As a result, production bounced back from the stagnation observed in August, showing the most growth since July 2022. This rebound was supported by a rapid reduction in backlogs. Employment also remained solid, rebounding from three periods of contraction. Additionally, the decline in prices continued for the fifth consecutive month, raising optimism about improved profit margins for manufacturers.
The Conference Board Consumer Confidence Index dropped once more in September, landing at 103.0 (1985=100), a decrease from the upwardly revised 108.7 observed in August. The Present Situation Index, reflecting consumers’ evaluations of current business and labor market conditions, saw a marginal increase to 147.1 (1985=100) from 146.7. On the other hand, the Expectations Index, which gauges consumers’ near-term outlook on income, business, and labor market conditions, saw a decline to 73.7 (1985=100) in September, after a dip to 83.3 in August. These expectations dipped below the critical threshold of 80, historically signaling an upcoming recession within the next year. Consumers’ concerns about an imminent recession also rose slightly, aligning with our projections of a brief and minor economic downturn anticipated for the first half of 2024.
“Consumer confidence fell again in September 2023, marking two consecutive months of decline,” said Dana Peterson, Chief Economist at The Conference Board. “September’s disappointing headline number reflected another decline in the Expectations Index, as the Present Situation Index was little changed. Write-in responses showed that consumers continued to be preoccupied with rising prices in general, and for groceries and gasoline in particular. Consumers also expressed concerns about the political situation and higher interest rates. The decline in consumer confidence was evident across all age groups, and notably among consumers with household incomes of $50,000 or more.”
WTI Oil entered September at $84.750 per barrel. Prices rose until September 27th where it hit its monthly high at $93.680 per barrel. It closed at $90.790 per barrel a few days later. This marks the fourth consecutive session of decreases, as investors reduced their holdings in risky assets due to a strong dollar and increasing Treasury yields. The dollar reached new highs against a basket of currencies, hitting levels not seen in ten months. Additionally, the 10-year US yield surged to its highest point since 2007, supported by robust US economic data that strengthened the belief that the Federal Reserve would maintain higher interest rates for an extended period. In September, the ISM Manufacturing PMI for the US indicated a significant slowdown in the manufacturing sector’s contraction, accompanied by a reduction in price pressures. Analysts also observed that a critical oil pipeline connecting Iraq and Turkey appeared poised for operations this week, potentially leading to added oil flows and alleviating global supply constraints. Meanwhile, markets are looking forward to the upcoming OPEC+ meeting, where it is anticipated that the group will uphold the previously announced output cuts.
The online US Oil Rig Count is at 623 which is down 8 compared to last month’s report and down 142 from Sept 30 of 2022. This key and leading indicator shows the current demand for products used in drilling, completing, producing, and processing hydrocarbons which all of us use every day as fuel sources and finished products. The number of rigs conducting oil and gas drilling in the United States continues to decrease. This decline in the U.S. rig count has occurred in 10 out of the last 11 weeks. Even the Permian Basin, which is the most productive region for oil and gas production in America, has experienced a drop in the number of operating rigs, with 337 currently compared to 342 last week and 350 a year ago.
This trend reflects the priority of drillers to focus on enhancing shareholder returns rather than expanding production coupled by the current administration’s desire to move away from fossil fuels. Additionally, there is uncertainty surrounding the economic outlook, leading the industry to remain cautious, especially compared to pre-pandemic times when the rig count showed a slower recovery over the past few years. To provide context, in 2019, there were 954 rigs drilling for oil and gas in the U.S. and, in 2014, there were 1609 rigs before oil prices dropped below $20 per barrel at the end of that year.
However, solid oil prices will likely prevent the rig count from decreasing significantly and may even lead to a rebound later this year. Currently, the West Texas Intermediate benchmark prices have been at around $75 per barrel, which is sufficient for most drillers to be profitable. Consequently, the U.S. is still expected to set a new annual oil production record in 2023, with a projected 12.4 million barrels per day, slightly surpassing the 2019 record of 12.3 million bpd.
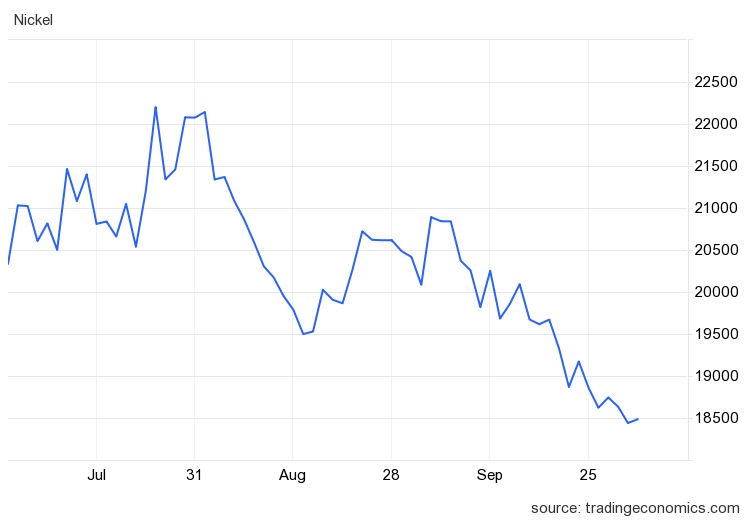
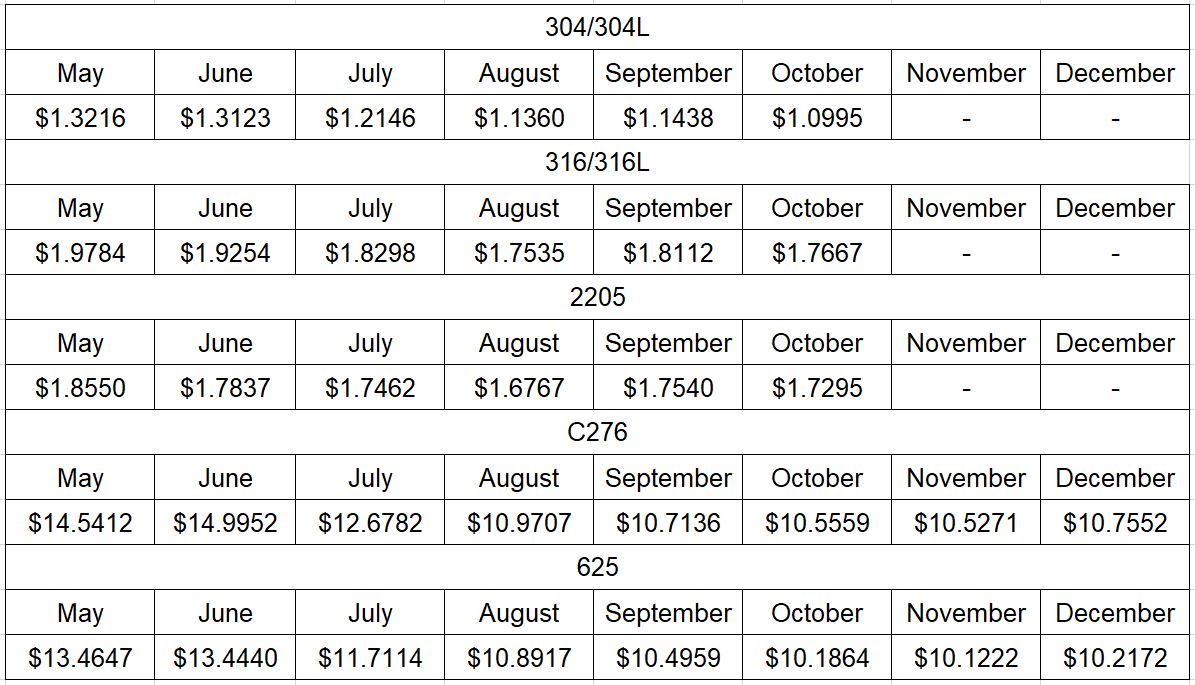
Nickel entered September at $9.476 per pound. Prices trended downward for the remainder of the month, closing out at $8.364 per pound. Prices are like what was seen this time two years ago. The surcharge for 304/304L, 316/316L, and 2205 trended downward for the month of October. The surcharges we have seen for C276 and 625 both trended upward. Molybdenum could be a cause for the uptick as it has not come back down to its pre-2023 levels.
Below is the 90 day Nickel Price Trend (US$ per tonne).

Commodity stainless plate deliveries look to have pulled in again to a 9 to 11 week range. Nickel alloy plates tightened up to the 11 to 15 week range. Duplex plates are currently sitting in the 10 to 12 week range. Carbon steel plate mill deliveries continue to reside in the 8 to 11 week delivery range. Keep in mind some duplex and nickel alloy plates will exceed the estimated ranges depending on the mill’s schedule.
Welded tubing – Currently deliveries for domestically welded stainless tubing has been seen in the 8 to 12 week range, whether small or large quantities (Up to 26 weeks for import). Carbon steel tubing deliveries have lead times ranging anywhere from 8 to 12 weeks when strip is available. Welded nickel alloy tubing ranges from 8 to 14 weeks (up to 42 weeks for imports). There has been decrease across the board in tubing lead times as domestic mills are looking for more work.
Seamless tubing – Current schedules reflect 10 to 20 weeks or more for carbon steel (24 to 26 weeks for Western European carbon seamless) and 10 to 35 weeks for stainless. Seamless nickel tubing is being offered at the 10 to 14 week delivery window so long as hollows are in stock. If hollows are not readily available, anticipate deliveries of seamless nickel tubing in the 20 to 32 week timeframe.
Please don’t hesitate to reach out if you have any questions about the current state of our industry’s material supply chain.
Here’s the current surcharge chart for 304/304LSS, 316/316LSS, 2205, C276, and 625.

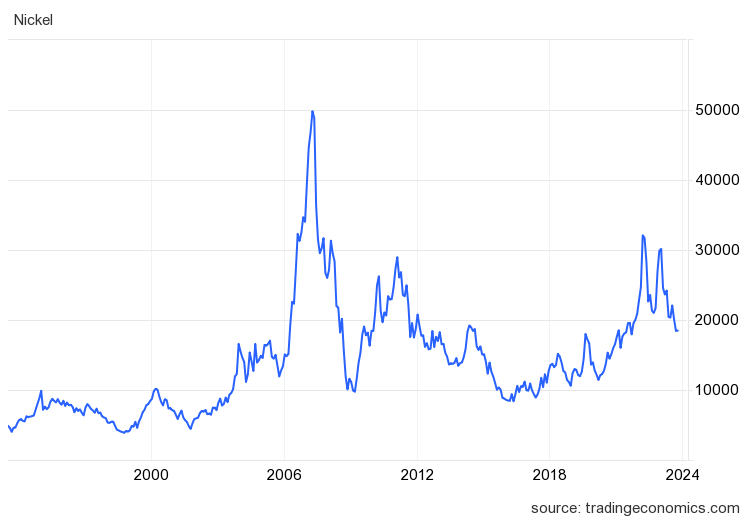
Nickel Prices have had an interesting ride over the past two decades with a low of $2.20/lb. in October of 2001 (following September 11 events) and a high of $23.72/lb. in May of 2007. Surcharges trail Nickel prices by approximately two months, so they would have been at their lowest in December of 2001 (304 was $0.0182/lb.) with the peak in July of 2007 (304 was $2.2839/lb.).
The chart below illustrates Nickel price by way of U.S. Dollars per Metric ton.

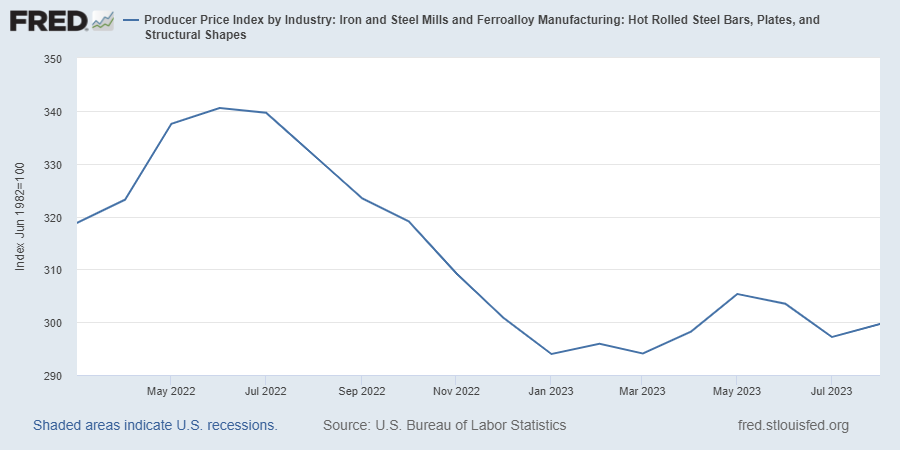
Here’s the Price Index for Hot Rolled Bars, Plate, and Structural Shapes.


