Before we dive into the numbers, here’s a little lighthearted ASME Code humor for you.
Why was the ASME Codebook always invited to parties?
Because it knew how to set the right standards for a good time!
Now it is time to buckle in because we’re off to the races with the latest industrial manufacturing news and information.
The ISM Manufacturing PMI came in at 47.2 percent in August, a 0.4 percentage point increase from July’s 46.8 percent. While the overall economy has been in expansion for 52 consecutive months following a brief contraction in April 2020, the manufacturing sector remains in contraction. (A Manufacturing PMI above 42.5 percent generally signals overall economic expansion over time.) The New Orders Index stayed in contraction, dropping to 44.6 percent, down 2.8 percentage points from July’s 47.4 percent. The Production Index for August was 44.8 percent, 1.1 percentage points lower than July’s 45.9 percent. The Prices Index rose to 54 percent, up 1.1 percentage points from July’s 52.9 percent. Meanwhile, the Backlog of Orders Index improved to 43.6 percent, up 1.9 percentage points from July’s 41.7 percent. The Employment Index climbed to 46 percent, a 2.6 percentage point increase from July’s 43.4 percent.
The Conference Board Consumer Confidence Index increased to 103.3 in August (1985=100), up from a revised 101.9 in July. The Present Situation Index, which reflects consumers’ views on current business and labor market conditions, rose to 134.4 from 133.1 in July. Additionally, the Expectations Index, which gauges consumers’ short-term outlook for income, business, and labor market conditions, improved to 82.5 in August. With July’s Expectations Index revised to 81.1, August marked the second consecutive month with a reading above 80, a level typically associated with the risk of recession. The cutoff date for preliminary results was August 21, 2024.
WTI Oil entered August at $76.310 per barrel. By the 12th it reached its monthly high of $80.060 per barrel and then its monthly low on the 21st at $71.930 per barrel. It closed the month at a slightly higher $73.550 per barrel but on a downward trend. On Friday, the release of US non-farm payroll data capped a week of disappointing labor market reports, heightening concerns about a slowdown in the world’s largest economy. Additionally, weak economic data from Europe fueled fears about energy demand, further exacerbated by ongoing concerns over sluggish consumption in China. Bank of America also revised its 2025 oil forecast, lowering Brent prices to $75 from $80 and the US benchmark to $71 from $75. In response to weak demand expectations in Asia, Saudi Aramco reduced its official selling prices for October. However, market sentiment was supported by OPEC+’s decision to delay a planned 180,000 bpd production increase until December, along with potential supply risks posed by a hurricane approaching the US Gulf Coast, a region that handles 60% of the country’s refining capacity.
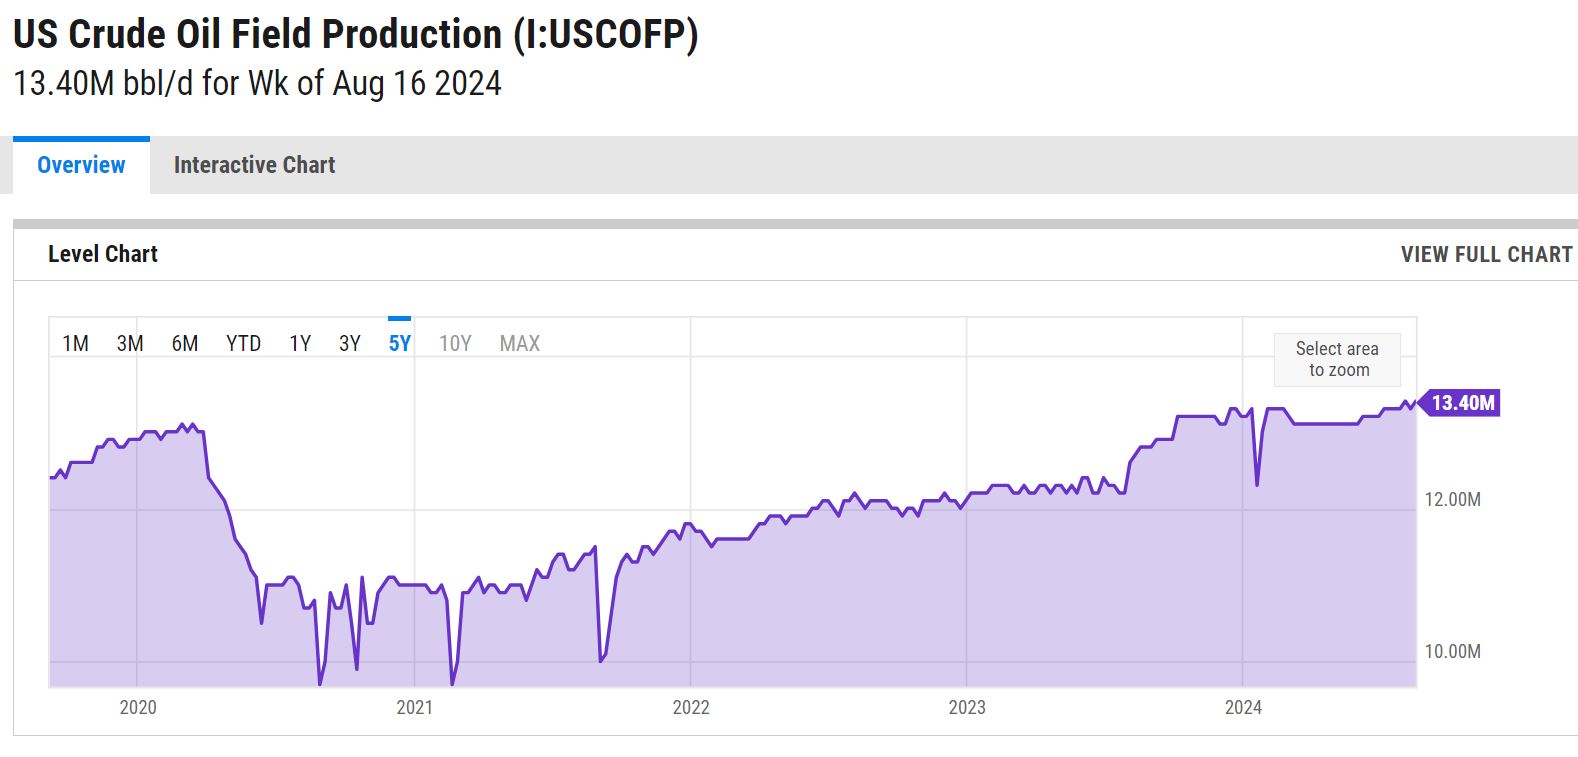
The online US Oil Rig Count is at 582 which is down 7 compared to last month’s report and down 50 from September 8 of 2023. This key and leading indicator shows the current demand for products used in drilling, completing, producing, and processing hydrocarbons which all of us use every day as fuel sources and finished products.
The number of rigs conducting oil and gas drilling in the United States continues to remain stagnant. This trend reflects the priority of drillers to focus on enhancing shareholder returns rather than expanding production coupled with the current administration’s desire to move away from fossil fuels. Additionally, uncertainty surrounds the economic outlook, leading the industry to remain cautious, especially compared to pre-pandemic times when the rig count showed a slower recovery over the past few years. To provide context, in 2019, 954 rigs were drilling for oil and gas in the U.S., and, in 2014, there were 1609 rigs before oil prices dropped below $20 per barrel at the end of that year.
However, solid oil prices will likely prevent the rig count from decreasing significantly and may even lead to a rebound in 2024. Currently, the West Texas Intermediate benchmark prices have been at around $75 per barrel, which is sufficient for most drillers to be profitable.
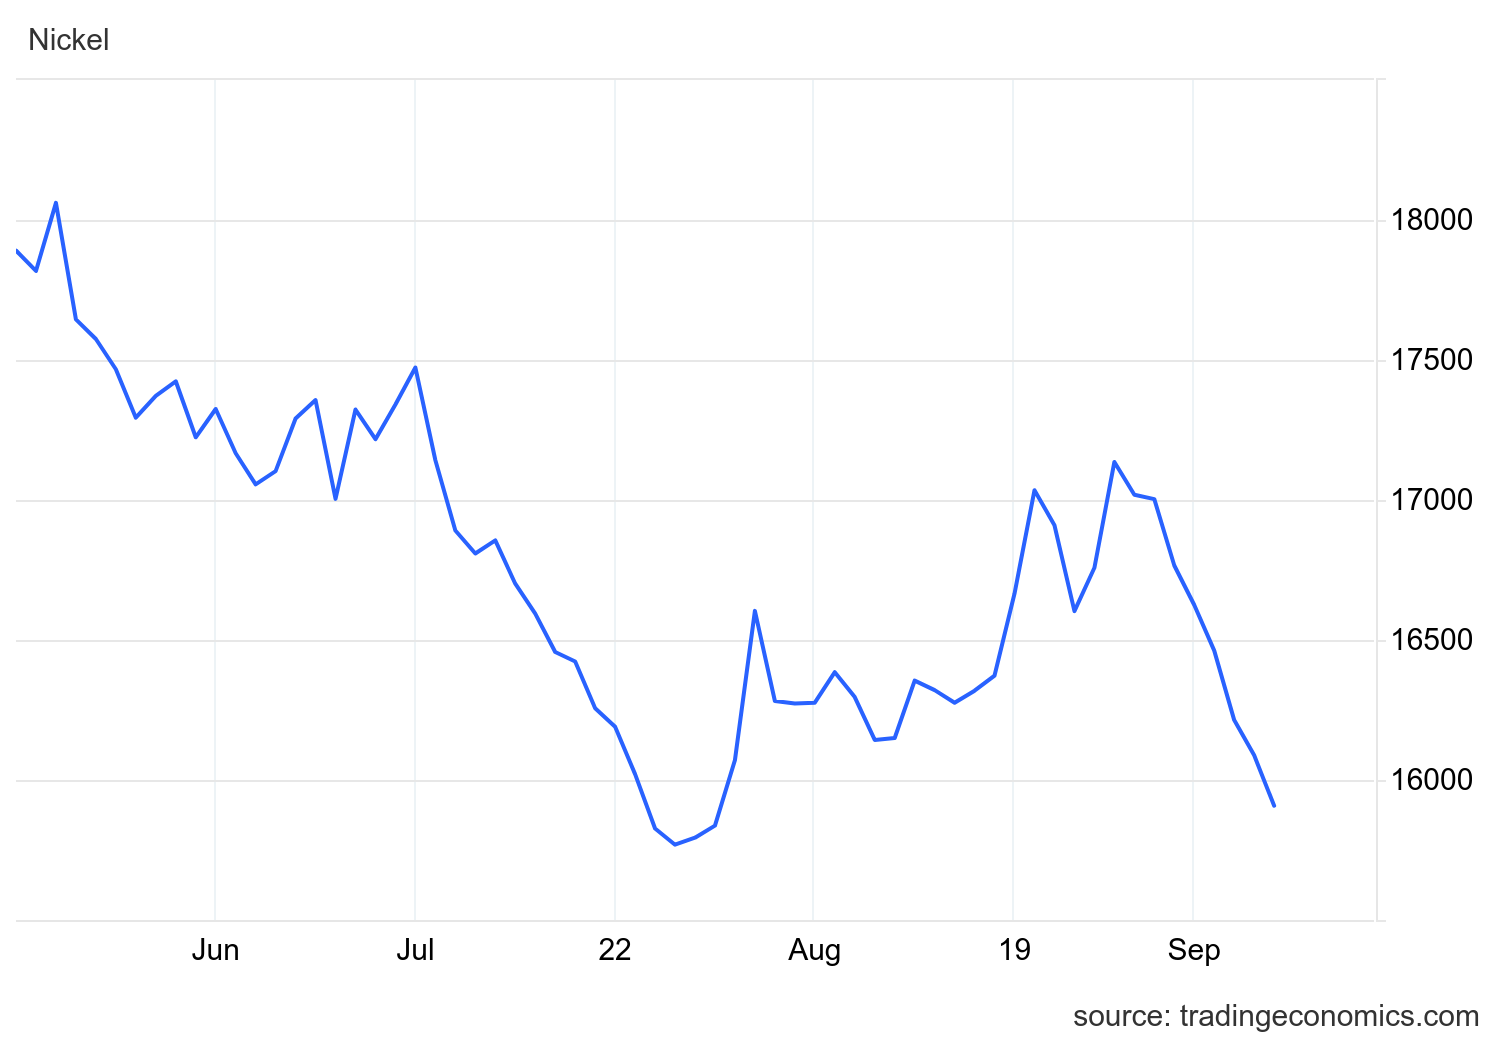
Nickel entered August at $7.385 per pound then hit its monthly low on the 8th at $7.322 per pound. Pricing stayed relatively stable the remaining of the month, peaking at $7.773 per pound on the 27th then closing the month at $7.605 per pound. Indonesia, which now accounts for more than half of global nickel production, has dramatically increased its output in recent years, leading to lower prices and causing producers in other regions to shut down. Furthermore, an additional 928,000 tons of capacity is expected to be added over the next three years, mainly to support electric vehicle (EV) battery production. The Indonesian government expects nickel prices to stabilize around current levels as new facilities help meet growing demand while maintaining a strong supply.
Tariffs have tightened. The White House announced new rules last month that strengthened tariffs on metals routed through Mexico. These rules build upon former President Donald Trump’s 2018 tariffs, which imposed a 25% tax on steel imports and a 10% tax on aluminum imports.
Although Mexico was granted an exemption to the tariffs in 2019, the new rules now require companies shipping steel and aluminum from Mexico to verify their origin. Officials report that 13% of steel and 6% of aluminum imported from Mexico actually originate from outside North America, including China, which produces half of the world’s steel. This announcement follows the Biden administration’s decision earlier this year to raise tariffs on $18 billion worth of Chinese imports, targeting goods such as electric vehicles, solar panels, semiconductors, syringes, and medical gloves.
The announcement coincides with a significant increase in US-China trade over recent decades, with imports exceeding $420 billion last year—up more than 300% since the turn of the century. However, last year’s imports represented a 20% drop from 2022, as tariffs have worked to narrow the trade deficit with China.
Domestic commodity stainless plate deliveries are holding at 5 to 6 weeks. Nickel alloy plates bumped out to 6 to 9 weeks compared to last month’s estimate of 6 to 7 weeks. Duplex plates followed the trend of the nickel alloys, pushing to the 6 to 9 week range. Domestic carbon steel plate mill deliveries continue to schedule in the 5 to 8 week range. Keep in mind, some plates will exceed the estimated ranges depending on the mill’s production schedule and slab availability.
Welded tubing – Currently deliveries for domestically welded stainless tubing are in the 10 to 12 week range, leaning towards the long side. For import tubes, deliveries are anywhere from 16 to 30 weeks. Carbon steel tubing deliveries have lead times ranging anywhere from 6 to 8 weeks when strip is available. Welded nickel alloy tubing ranges from 12 to 14 weeks (up to 42 weeks for imports).
Seamless tubing – Current schedules reflect 6 to 26 weeks or more for carbon steel and 3 to 26 weeks for stainless. Seamless nickel tubing is being offered at the 8 to 12 week delivery window so long as hollows are in stock. If hollows are not readily available, anticipate deliveries of seamless nickel tubing in the 40 to 44 week timeframe as most hollows are of foreign melt.
Please don’t hesitate to reach out if you have any questions about the current state of our industry’s material supply chain.
Below is the 90 day Nickel Price Trend (US$ per tonne).
Here’s the current surcharge chart for 304/304LSS, 316/316LSS, 2205, C276, and 625.
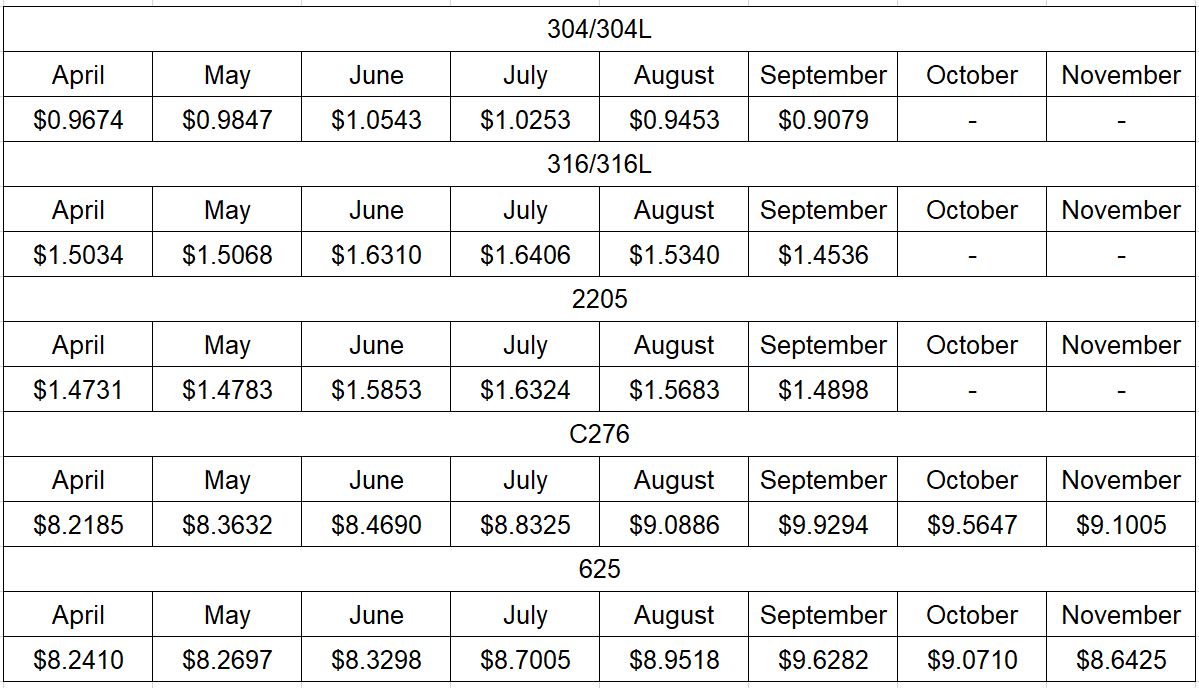
Nickel Prices have had an interesting ride over the past two decades with a low of $2.20/lb. in October of 2001 (following September 11 events) and a high of $23.72/lb. in May of 2007. Surcharges trail Nickel prices by approximately two months, so they would have been at their lowest in December of 2001 (304 was $0.0182/lb.) with the peak in July of 2007 (304 was $2.2839/lb.).
The chart below illustrates Nickel price by way of U.S. Dollars per Metric ton.

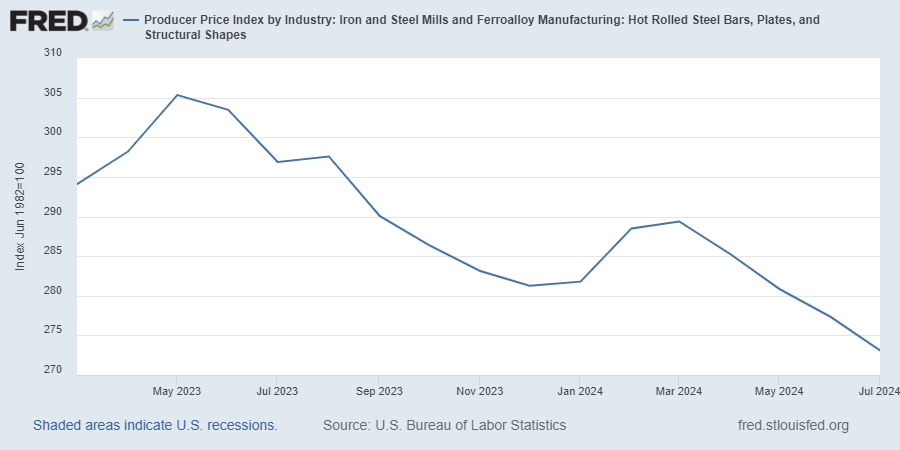
Here’s the Price Index for Hot Rolled Bars, Plate, and Structural Shapes.