In February 2024, the ISM Manufacturing Index (PMI) in the U.S. dropped to 47.8, down from 49.1 the previous month. This figure was significantly below the anticipated 49.5, indicating the 16th consecutive month of manufacturing activity decline and dashing hopes for a sector rebound. The contraction in new orders (49.2 compared to January’s 52.5) led to a corresponding decline in production levels (48.4 compared to 50.4), although the decrease in backlog of orders was less severe (46.3 compared to 44.7). Prices increased for the second consecutive month (52.5 compared to 52.9), albeit at a slower pace, driven by higher costs in transportation equipment, chemicals, and computer and electronic products. Concurrently, a renewed drop in consumer demand resulted in reduced capacity needs and a fifth consecutive month of declining employment levels (45.9 compared to 47.1).
In February, the Consumer Confidence Index dropped to 106.7 (1985=100), a decline from the revised January figure of 110.9. This decrease followed three consecutive months of improvement. However, with the downward revision of January from the initial reading of 114.8, the data now indicate that there was no significant surge in confidence at the beginning of 2024. The Present Situation Index, which reflects consumers’ evaluation of current business and labor market conditions, decreased from 154.9 in January to 147.2 in February. Meanwhile, the Expectations Index, based on consumers’ short-term outlook for income, business, and labor market conditions, declined to 79.8 (1985=100), down from the revised January figure of 81.5. A reading below 80 in the Expectations Index often suggests an impending recession.
“The decline in consumer confidence in February interrupted a three-month rise, reflecting persistent uncertainty about the US economy,” said Dana Peterson, Chief Economist at The Conference Board. “The drop in confidence was broad-based, affecting all income groups except households earning less than $15,000 and those earning more than $125,000. Confidence deteriorated for consumers under the age of 35 and those 55 and over, whereas it improved slightly for those aged 35 to 54.”
WTI Oil entered February at $73.790 per barrel. Within a day, prices hit the month low of $72.300 per barrel. Prices then trended upward for the remainder of the month, closing out February at $78.260 per barrel. All eyes are on the upcoming OPEC+ meeting in March, where producers will likely stick to voluntary production limits until at least the June Ministerial Meeting to help stabilize the market. Uncertainty surrounding ceasefire talks between Israel and Hamas, as well as ongoing Houthi attacks on Red Sea shipping also added a risk premium to oil prices. Meanwhile, the most recent EIA report showed a larger-than-expected increase in US crude stocks, climbing by 4.199 million barrels last week due to a slowdown in refinery processing.
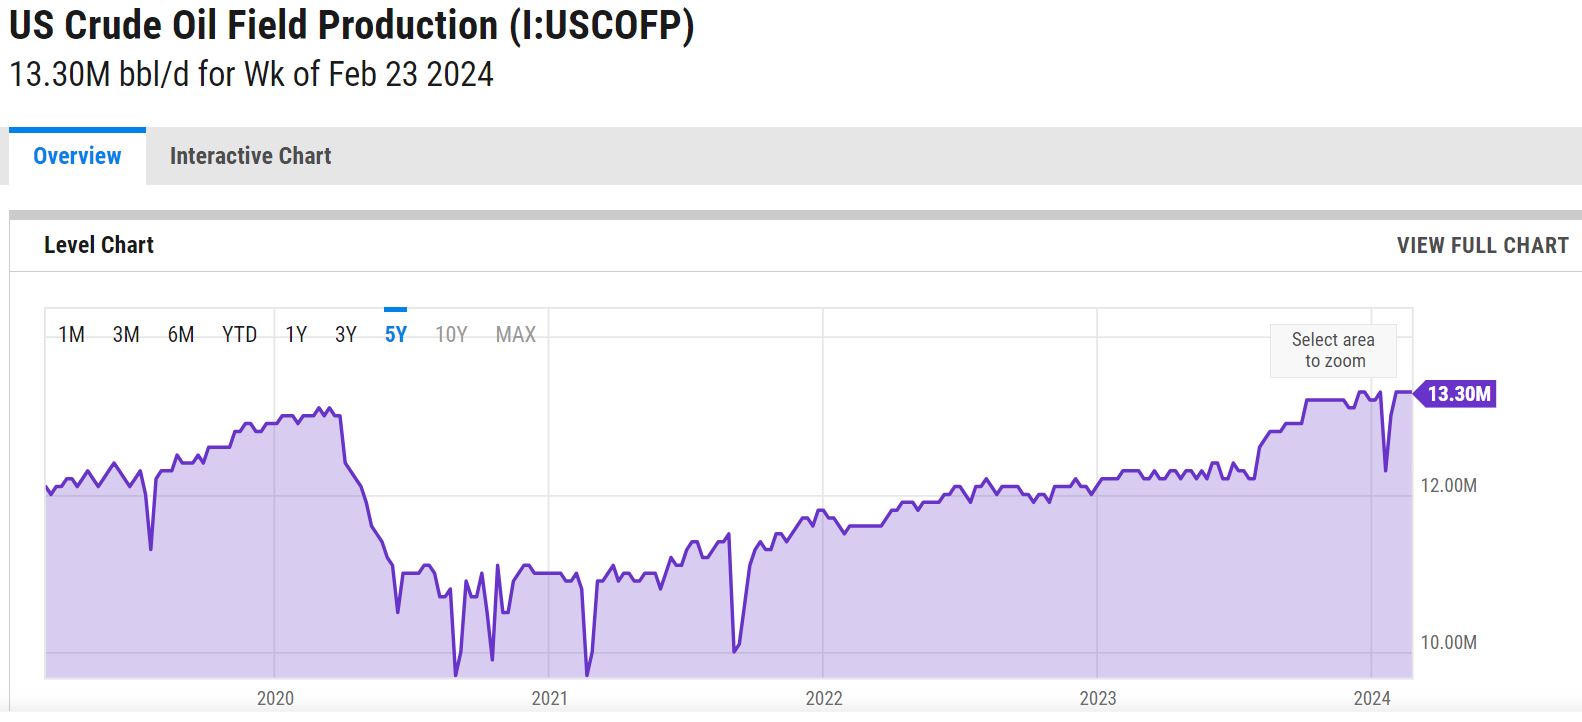
The online US Oil Rig Count is at 629 which is up 10 compared to last month’s report and down 120 from Mar 3 of 2023. This key and leading indicator shows the current demand for products used in drilling, completing, producing, and processing hydrocarbons which all of us use every day as fuel sources and finished products.
The number of rigs conducting oil and gas drilling in the United States continues to remain stagnant. This trend reflects the priority of drillers to focus on enhancing shareholder returns rather than expanding production coupled with the current administration’s desire to move away from fossil fuels. Additionally, uncertainty surrounds the economic outlook, leading the industry to remain cautious, especially compared to pre-pandemic times when the rig count showed a slower recovery over the past few years. To provide context, in 2019, 954 rigs were drilling for oil and gas in the U.S., and, in 2014, there were 1609 rigs before oil prices dropped below $20 per barrel at the end of that year.
However, solid oil prices will likely prevent the rig count from decreasing significantly and may even lead to a rebound in 2024. Currently, the West Texas Intermediate benchmark prices have been at around $75 per barrel, which is sufficient for most drillers to be profitable.

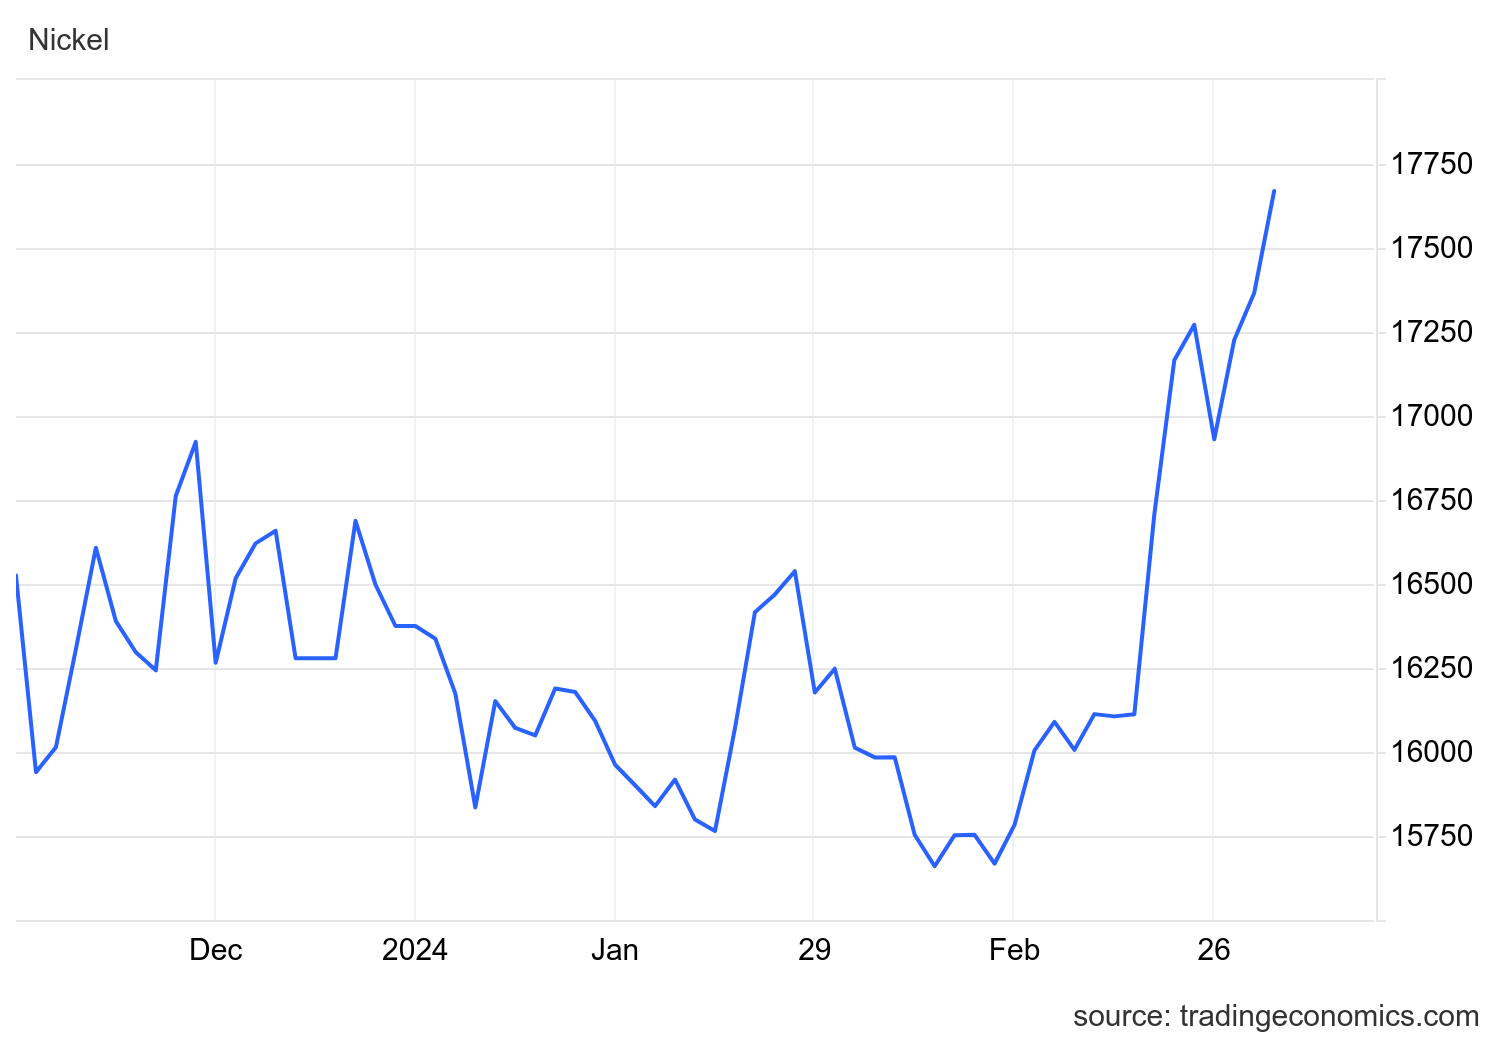
Nickel entered February at $7.250 per pound. Prices trended down for a few days until it hit a 39-month low of $7.103 per pound on February 6th. Prices then rose for the remainder of February, closing the month at $8.015 per pound. Concerns about tight supply increased when the leading exporter, Indonesia, postponed the issuance of new mining quotas, leading smelters to reduce production. This delay in the output quota, known as RKAB, was attributed to the country’s presidential election and a change in the permit validity period, extending it to three years from the previous one-year duration. In contrast, Australia, another significant player in the industry, implemented stimulus measures and included the metal in its Critical Minerals List to support local producers. This move followed several shutdowns at mining plants due to low prices.
Below is the 90 day Nickel Price Trend (US$ per tonne).

Domestic commodity stainless plate deliveries have pulled in yet again on certain grades and sizes to a 5 to 7 week range. Nickel alloy plates pulled in to the 6 to 8 week range. Duplex plates bump in two weeks, sitting in the 6 to 7 week range. Domestic carbon steel plate mill deliveries are scheduling in the 6 to 9 week range. Keep in mind, some plates will exceed the estimated ranges depending on the mill’s production schedule.
Welded tubing – Currently deliveries for domestically welded stainless tubing are in the 6 to 12 week range, leaning towards the shorter side. For import tubes, deliveries are anywhere from 18 to 26 weeks. Carbon steel tubing deliveries have lead times ranging anywhere from 6 to 12 weeks when strip is available. Welded nickel alloy tubing ranges from 8 to 14 weeks (up to 42 weeks for imports).
Seamless tubing – Current schedules reflect 10 to 20 weeks or more for carbon steel (24 to 26 weeks for Western European carbon seamless) and 10 to 35 weeks for stainless. Seamless nickel tubing is being offered at the 10 to 14 week delivery window so long as hollows are in stock. If hollows are not readily available, anticipate deliveries of seamless nickel tubing in the 20 to 32 week timeframe as most hollows are of foreign melt.
Please don’t hesitate to reach out if you have any questions about the current state of our industry’s material supply chain.
Here’s the current surcharge chart for 304/304LSS, 316/316LSS, 2205, C276, and 625.

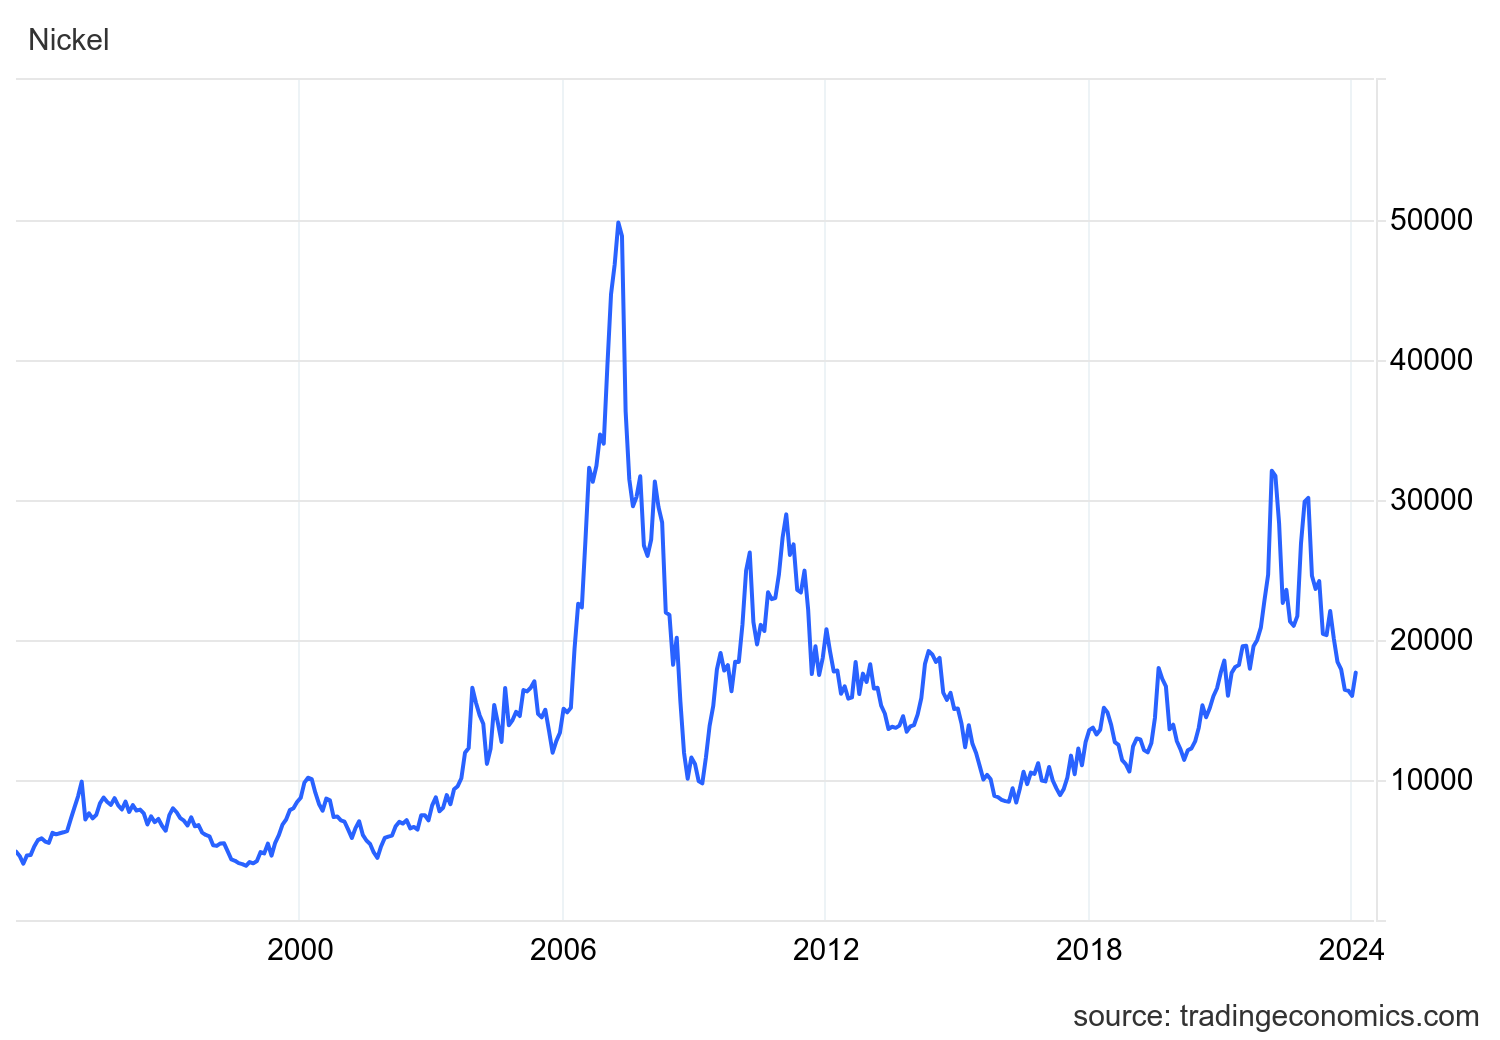
Nickel Prices have had an interesting ride over the past two decades with a low of $2.20/lb. in October of 2001 (following September 11 events) and a high of $23.72/lb. in May of 2007. Surcharges trail Nickel prices by approximately two months, so they would have been at their lowest in December of 2001 (304 was $0.0182/lb.) with the peak in July of 2007 (304 was $2.2839/lb.).
The chart below illustrates Nickel price by way of U.S. Dollars per Metric ton.

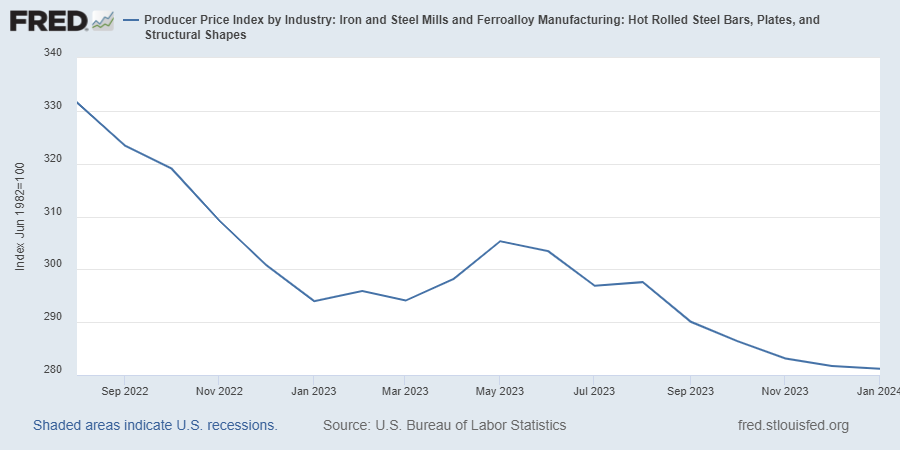
Here’s the Price Index for Hot Rolled Bars, Plate, and Structural Shapes.


