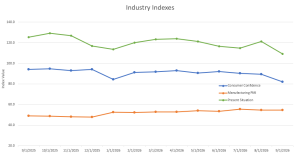
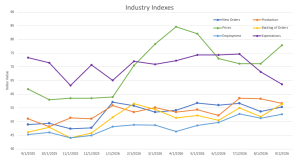
Economic activity in the manufacturing sector expanded in September for the ninth consecutive month, say the nation’s supply executives in the latest ISM® Manufacturing PMI® Report.
The Manufacturing PMI® registered 54.5 percent in September, 0.1 percentage point below the August figure of 54.6 percent. The overall economy continued in expansion for the 23rd month in a row. (Important data point reference: A Manufacturing PMI reading above 50 percent indicates that the manufacturing economy is generally expanding; below 50 percent indicates that it is generally declining. A Manufacturing PMI above 42.5 percent, over a period of time, indicates that the overall economy, or gross domestic product (GDP), is generally expanding; below 42.5 percent, it is generally declining. The distance from 50 percent or 42.5 percent is indicative of the extent of the expansion or decline.)
The Conference Board Consumer Confidence Index® fell by 6.7 points to 81.9 (1985=100) in September, down from 88.6 in August.
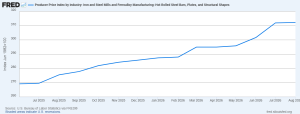
Please see the graphs for other notable indexes related to our industry.
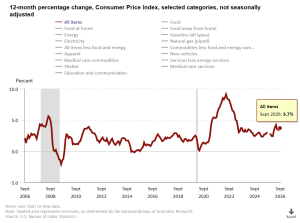
The Consumer Price Index (CPI, otherwise known as our “inflation” friend) is currently at 3.7% in September 2026, up from 3.4% in August 2026, and up from 3.5% in July 2026. CPI tracks the rate of change in US inflation over time, and the following shows the trends over the past 20 years.
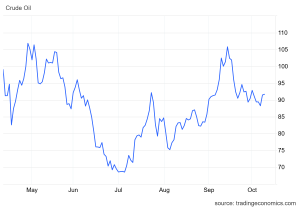
Crude oil prices fell below $91 a barrel on Friday, consolidating after a 3.6% gain in the previous session, amid easing concerns over Middle East supply disruptions. US President Trump said that Washington was engaged in “productive discussions” with Iran and would refrain from attacking the country ahead of the midterm elections. Meanwhile, reports indicated that Tehran’s foreign minister said Iran was reviewing the US response to its proposal to reopen the Strait of Hormuz within seven days. Adding to the downward pressure, China is set to resume refined fuel exports in October following a brief suspension during the Golden Week holiday. On the other hand, threats to shipping through the Gulf and the Strait of Hormuz persist and supply risks continued in the Gulf of Mexico, where Hurricane Isaias forced producers to shut in approximately 1.3 million bpd as of Thursday, according to the US Marine Minerals Administration. Crude oil prices changed little for the week.
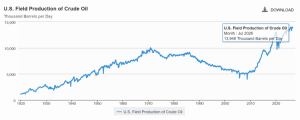
The online US Oil Rig Count is currently reported as 598, which is up 7 compared to last month’s report and up 49 from September 25, 2025. This key and leading indicator shows the current demand for products used in drilling, completing, producing, and processing hydrocarbons, which we all use every day as fuel sources and finished products.
The number of rigs conducting oil and gas drilling in the United States remains stagnant, but efficiency has increased significantly over the years, as shown in the chart below. We continue to drill at record production levels. However, this trend of fewer rigs still reflects the priority of drillers to focus on efficiency and enhancing shareholder returns rather than expanding production through capital investments due to the previous administration’s desire to move away from fossil fuels. This philosophy might change now that the Trump administration is entirely behind fossil fuels. To provide context, in 2019, 954 rigs were drilling for oil and gas in the US, and, in 2014, there were 1609 rigs before oil prices dropped below $20 per barrel at the end of that year.
Tariffs have tightened, loosened, and will keep evolving as the Trump administration navigates global negotiations.
Whew… There’s still A LOT to unpack here, so hold on for the roller coaster ride.
A little background on where this all started and what it means. Tariffs are duties placed on foreign goods, paid by domestic importers to Customs and Border Protection at ports of entry. President Trump introduced tariffs on select Chinese goods in his first term in 2018, and President Joe Biden later maintained them, along with duties on steel and aluminum from most countries. In February 2025, Trump reinstated tariffs (10% higher on Chinese imports, bringing them to 35%, and 25% on Mexican and Canadian goods (except oil, taxed at 10%)). Since then, the environment has been ever-changing, with tariffs fluctuating month-to-month based on negotiations with other nations.
Tariff Update as of October 2026.
The tariff framework that has been taking shape all year is now largely set. Here is where things stand as of October 2026, with no major changes since last month’s newsletter, and what it means for you.
Section 122 Is Gone. Section 232 and 301 are the Laws of the Land.
As we reported last month, Section 122 expired by statute on July 24th, and Section 301 forced labor tariffs took effect at 12:01 am ET on July 24th.
Please refer to our prior newsletters for details on Sections 232 and 301. You can also find them on our website (click here).
Section 301 Is Already Being Challenged.
On August 3rd, the attorneys general of 25 states, co-led by Oregon, Arizona, and California, filed a complaint in the Court of International Trade challenging the Section 301 forced labor tariffs as unlawful. Small business plaintiffs have filed separately as well. This is the same legal playbook that took down IEEPA and Section 122. We will be watching it closely. That said, Section 301 has survived more than 4,000 court challenges since 1974 and rests on far more durable legal authority than either of those. We do not expect this to move the needle in the near term, but we will keep you posted.
New Section 232 Aluminum Onshoring Incentive Program.
On July 20th, President Trump signed a proclamation establishing a new Section 232 onshoring investment incentive program. Companies that commit to building, refurbishing, or expanding U.S. primary aluminum production facilities and receive Commerce Department approval can import primary aluminum at half the otherwise applicable Section 232 tariff rate. Construction must begin by January 20, 2029. The proclamation does not extend the reduced rate to derivative articles or industrial equipment. This clearly signals that the administration is serious about bringing primary aluminum production back to the United States.
One Process Change Worth Noting.
The petition-based inclusion process, which previously allowed domestic manufacturers and trade associations to formally request that specific HTS codes be added to the Section 232 scope, has ended. Going forward, Commerce and USTR will adjust product coverage on a rolling basis at their own discretion. There is no longer a formal submission window.
That means if you believe imported finished pressure vessels and heat exchangers should be explicitly covered under Section 232 derivative tariffs, engage directly with your elected officials. Not a petition. A phone call. A meeting. A letter.
As pressure vessel and heat exchanger fabricators, we need to keep pushing for protection for steel product manufacturers, not just domestic raw-material suppliers. We encourage every customer and partner in this industry to make that contact.
What This Means for Ward.
We continue to purchase 80 to 90 percent of our material domestically depending on the project. Our total material spend has increased approximately 15 to 30 percent since Section 232 tariffs were enacted, resulting in a 10 to 20 percent overall unit price increase after labor. We are absorbing what we can. We are passing through what we must. And we will continue to monitor the evolving situation and update you each month on the latest developments.
The administration has published several tariff fact sheets on the White House website (click here) as the tariff topic has evolved.
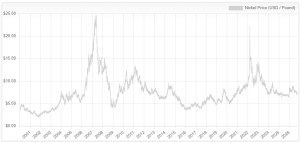
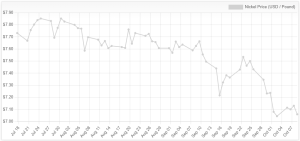
Nickel fell to around $7.076 per pound, hitting its lowest level since December 2025 as ample availability continued to weigh on prices. Philippine nickel ore shipments to Indonesia have increased in recent months, and the extra supply has helped Indonesian smelters maintain access to feedstock. Additionally, LME on-warrant inventories rose to 278,898 tons by September 24 from an August low of 264,444 tons, reinforcing comfortable stocks in the market. Demand has also struggled to keep pace with available supply, with nickel consumption still largely tied to stainless-steel production and battery demand providing only a limited offset. Meanwhile, Indonesia’s lower nickel ore quota remains below the roughly 315 million tons needed to run processing capacity at full rates, while water shortages have prompted some smelters at the Morowali Industrial Park to cut production, potentially affecting around 100,000 tons of nickel pig iron output.
Plate mill plate lead times (weeks):
Domestic:
Stainless & Duplex: 13 to 14
Nickel Alloys: 14 to 15
Carbon steel: 13 to 32
*Keep in mind, some plates will exceed the estimated ranges depending on the mill’s production schedule and slab availability. *
Welded tubing lead times (weeks):
Domestic:
Carbon: 44+
Stainless: 14 to 16
Nickel Alloy: 14 to 22
Import:
Carbon: 22 to 30
Stainless: 16 to 30
Nickel Alloy: 16 to 42
Seamless tubing lead times (weeks):
Domestic:
Carbon: 10 to 16
Stainless: 8 to 14
Nickel Alloy: 8 to 14
*Lead times are accurate if bar is in stock. If not, lead times can increase to 44 weeks as most bars are of foreign melt. *
ASME head lead times (weeks):
Domestic:
Stainless: 7 to 22
Nickel Alloys: 7 to 22
Carbon steel: 7 to 25
*Keep in mind, some heads will fall outside the listed ranges depending on the alloy and size/thickness. Some head vendors stock common sizes (under 72” OD) and alloys, allowing them to ship next day. *
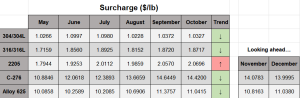
Nickel Prices have had an interesting ride over the past three decades, with a low of $2.20/lb. in October 2001 (following the September 11 events) and a high of $23.72/lb. in May 2007. Surcharges trail Nickel prices by about two months, so they would have been lowest in December 2001 (304 was $0.0182/lb.) and highest in July 2007 (304 was $2.2839/lb.).