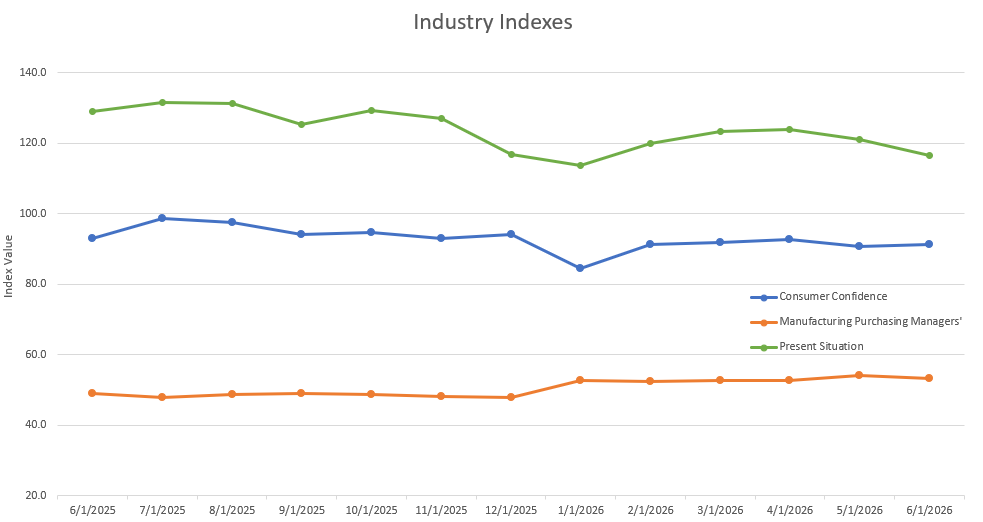
Economic activity in the manufacturing sector expanded in June for the sixth consecutive month, say the nation’s supply executives in the latest ISM® Manufacturing PMI® Report.
The Manufacturing PMI® registered 53.3 percent in June, 0.7 percentage point lower than in May. The overall economy continued in expansion for the 20th month in a row. (Important data point reference: A Manufacturing PMI reading above 50 percent indicates that the manufacturing economy is generally expanding; below 50 percent indicates that it is generally declining. A Manufacturing PMI above 42.5 percent, over a period of time, indicates that the overall economy, or gross domestic product (GDP), is generally expanding; below 42.5 percent, it is generally declining. The distance from 50 percent or 42.5 percent is indicative of the extent of the expansion or decline.)
The Conference Board Consumer Confidence Index® inched up by 0.6 points to 91.2 (1985=100) in June, up from a downwardly revised 90.6 in May.
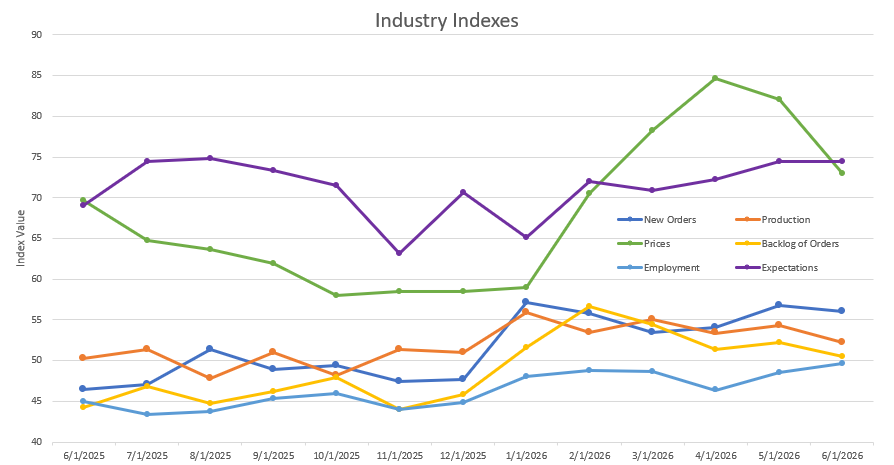
Please see the graphs for other notable indexes related to our industry.
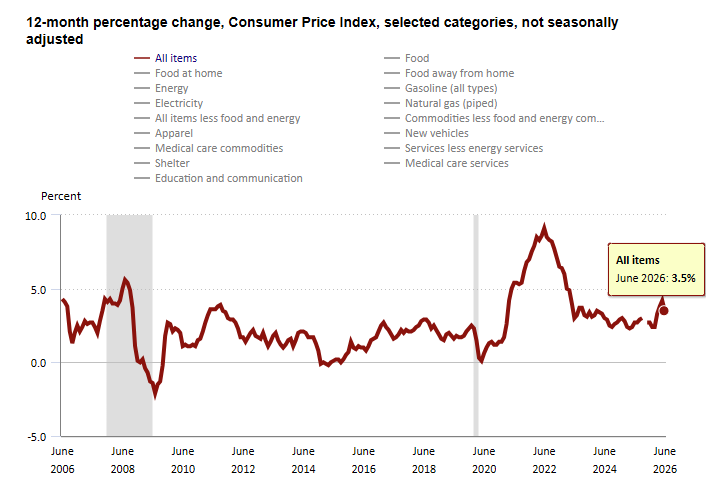
The Consumer Price Index (CPI, otherwise known as our “inflation” friend) is currently at 3.5% in June 2026, down from 4.2% in May 2026 and 3.8% in April 2026. CPI tracks the rate of change in US inflation over time, and the following shows the trends over the past 20 years.
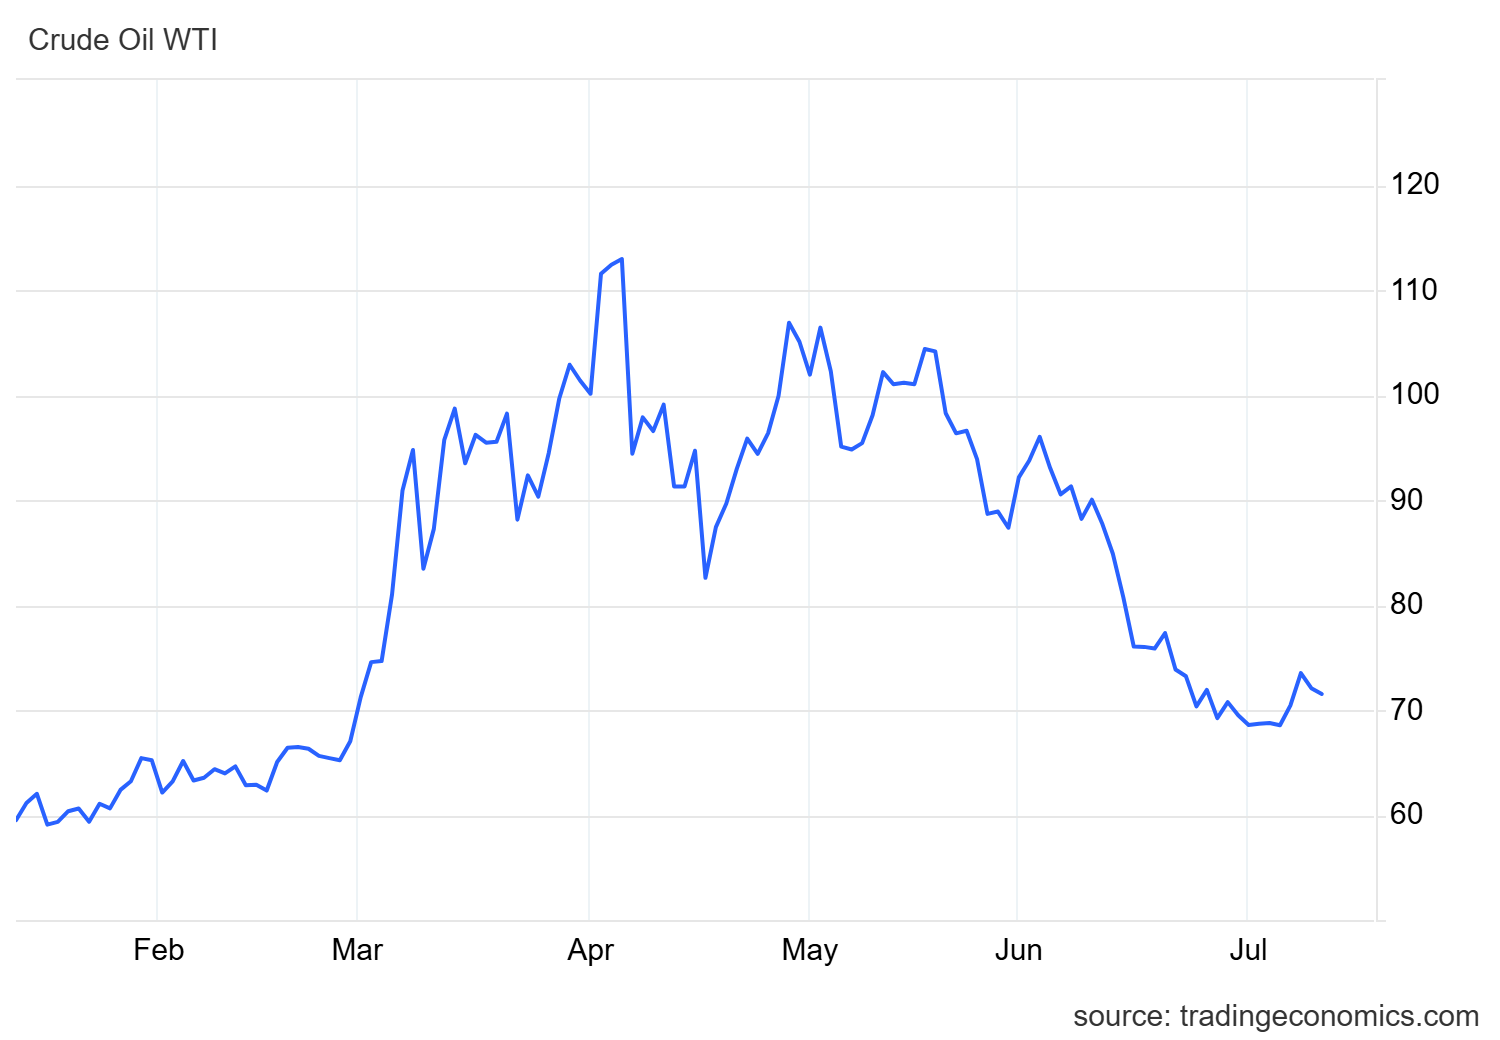
Crude oil slipped to around $71.2 per barrel on Friday (7/10/26) but remained on track for a weekly gain of about 3.5% as renewed US-Iran tensions disrupted shipping through the Strait of Hormuz and raised supply concerns. Markets continued to monitor developments after fresh attacks strained the ceasefire, although talks between Washington and Tehran are expected to continue. President Donald Trump said the two sides had agreed to keep negotiations open but warned that the ceasefire was effectively over following renewed hostilities. Earlier reports indicated technical discussions could resume, with a Qatari delegation arriving in Iran as part of diplomatic efforts. The IEA cautioned that a prolonged escalation could undermine plans to rebuild global oil inventories later this year. Meanwhile, the United Arab Emirates increased crude production to a record high last month, highlighting efforts by Gulf producers to maintain exports despite ongoing uncertainty.
The online US Oil Rig Count is currently reported as 580, which is up 17 compared to last month’s report and up 41 from July 03, 2025. This key and leading indicator shows the current demand for products used in drilling, completing, producing, and processing hydrocarbons, which we all use every day as fuel sources and finished products.
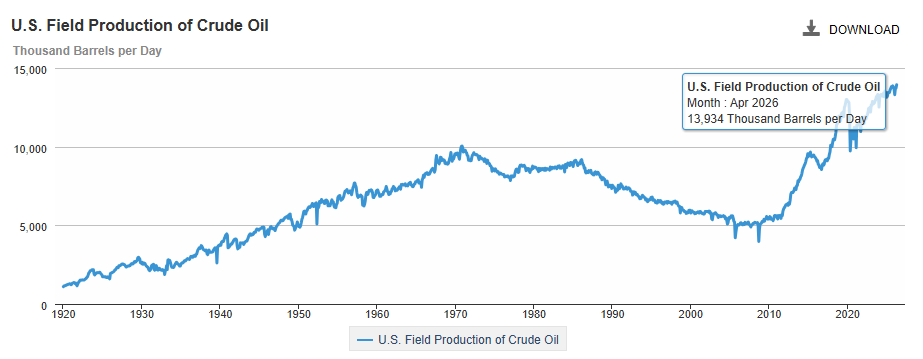
The number of rigs conducting oil and gas drilling in the United States remains stagnant, but efficiency has increased significantly over the years, as shown in the chart below. We are drilling at or near record production levels. However, this trend of fewer rigs still reflects the priority of drillers to focus on efficiency and enhancing shareholder returns rather than expanding production through capital investments due to the previous administration’s desire to move away from fossil fuels. This philosophy might change now that the Trump administration is entirely behind fossil fuels. To provide context, in 2019, 954 rigs were drilling for oil and gas in the US, and, in 2014, there were 1609 rigs before oil prices dropped below $20 per barrel at the end of that year.
Tariffs have tightened, untightened, and will continue to evolve as the Trump administration navigates global negotiations.
Whew… There’s still A LOT to unpack here, so hold on for the roller coaster ride.
A little background on where all of this started and what it means. Tariffs are duties placed on foreign goods, paid by domestic importers to Customs and Border Protection at ports of entry. President Trump introduced tariffs on select Chinese goods in his first term back in 2018, which President Joe Biden later maintained, along with duties on steel and aluminum from most countries. In February of 2025, Trump reinstated tariffs—10% more on Chinese imports, bringing them to 35%, and 25% on Mexican and Canadian goods (except for oil, taxed at 10%). From there, it has been an ever-changing environment, with tariffs fluctuating month to month based on negotiations with other nations.
Tariff Update for July 2026
The tariff landscape has reached a transition point. Here is where things stand as of July 2026 and what it means for you.
Section 122 Is Gone
Section 122 expired July 24th by statute. Congress did not act to extend it and the president cannot extend it unilaterally. That chapter is closed. The administration has spent the last several months engineering its replacement, and that replacement is now taking shape.
What Comes Next… The Section 301 Bridge
This is the most important development this month. The Office of the United States Trade Representative (USTR) proposed additional tariffs on imports from 60 economies under Section 301 of the Trade Act of 1974, grounded in a forced labor investigation. Proposed rates run from 10% to 12.5% depending on the country. The public comment period closed July 6th and public hearings ran July 7th through July 9th. USTR’s stated intent is to have the new tariffs in place right around the July 24th Section 122 expiration date.
Unlike IEEPA, which the Supreme Court struck down in February, Section 301 tariffs carry no expiry date, no rate cap, and a legal track record that has survived more than 4,000 court challenges since 1974. The administration found its durable legal ground. This is the framework your customers should be planning around going forward.
The rates are not yet final. USTR may modify, finalize, or decline to adopt the proposed action after the hearings. We will update you as soon as final rates are announced.
What Has Not Changed… Section 232 Stands
None of the above pertains to Section 232, which governs tariffs on steel, aluminum, and copper. It was written specifically to authorize tariff action on national security grounds. It has survived every legal challenge to date and remains fully in effect.
The April 6th framework remains the operative structure:
- Raw mill products, plate, sheet, tube, pipe, and fittings at 50% on the full customs value.
- Derivative articles substantially made of steel, aluminum, or copper at 25% on full customs value.
- Certain metal-intensive industrial equipment at a temporary 15% through December 31, 2027.
- Products made with 100% U.S.-origin metal at 10%.
- Products with 15% or less metal content by weight are not subject to Section 232 tariffs.
One important note on how Section 301 and Section 232 interact. For most trade partner countries subject to the new forced labor investigation, the proposed Section 301 tariffs at 10% to 12.5% would not stack on top of Section 232 tariffs. Our raw material inputs already covered under Section 232 would not be double-hit from those countries. For China and other bad actors, however, the picture is different. Existing Section 301 tariffs from 2018 remain fully in place at 7.5% to 25% depending on the product, and those do stack with Section 232. A Chinese-origin steel product in 2026 can face the base MFN rate plus 25% Section 301 plus 50% Section 232, putting the combined effective rate well above 75% before any anti-dumping or countervailing duties are even applied. The new forced labor investigation tariffs would be a separate additional layer on top of all of that for Chinese goods. If any portion of your supply chain has Chinese content, that exposure is real and worth understanding in detail.
How Does This Affect Imported Pressure Vessels and Heat Exchangers?
Per our understanding, pressure vessels and heat exchangers are fabricated equipment classified under HTS Chapter 84 (industrial machinery), not Chapters 72 through 76 (raw steel mill products). This distinction matters significantly under the April 6th Section 232 overhaul.
For aluminum heat exchangers, the picture is clear. HTS subheadings 8419.50.10 and 8419.50.50 are explicitly listed as aluminum derivative articles in the April 6th proclamation, meaning imported finished aluminum heat exchangers are subject to a 25% tariff on the full customs value of the unit, not just the metal content. On a $500,000 imported aluminum heat exchanger, the tariff base is the full $500,000.
For stainless steel, alloy, and carbon steel heat exchangers, and for pressure vessels of any material, the situation is less settled. These products typically classify under HTS 8419.50.50 and 8419.89, respectively, neither of which appears in the steel derivatives section of the April 6th annexes. This creates a genuine gray area. Imported finished steel heat exchangers and pressure vessels may not currently be explicitly covered by the Section 232 derivative tariff on the finished unit. As USTR finalizes the Section 301 exclusion list, we will be watching closely to see how finished pressure equipment is treated.
It is also worth noting what the Annex language does and does not say about tanks and vessels under Chapter 73. Two codes are listed under Annex I-A at the 50% rate. HTS 7309.00.00 covers iron or steel reservoirs, tanks, vats, and similar containers with a capacity exceeding 300 liters, but only those not fitted with mechanical or thermal equipment. HTS 7311.00.00 covers iron or steel containers for compressed or liquefied gas.
While these codes may appear to cover pressure vessels at first glance, the critical limitation in 7309 is that phrase: “not fitted with mechanical or thermal equipment”. A fabricated ASME pressure vessel with nozzles, instrumentation, internals, and process connections would almost certainly not qualify under that language. Neither code uses the word “vessel” at all. A purpose-engineered ASME Code vessel is fundamentally different from a simple storage tank or container. The customs classification of fabricated pressure equipment under Chapter 73 versus Chapter 84 is a fact-specific determination, and Chapter 84 typically governs process equipment of this nature.
What is unambiguous for all product types is that the raw material inputs (i.e. stainless plate, carbon steel plate, seamless and welded tubing, and pipe fittings) are covered at the full 50% rate under Annex I-A, regardless of how the finished equipment is ultimately classified.
One Process Change Worth Noting
The petition-based inclusion process that previously allowed domestic manufacturers and trade associations to formally request that specific HTS codes be added to Section 232 scope has been terminated. Going forward, Commerce and USTR will adjust product coverage on a rolling basis at their own discretion. There is no formal submission window anymore.
That means if you believe imported finished pressure vessels and heat exchangers should be explicitly covered under Section 232 derivative tariffs, the path forward is direct engagement with your elected officials. Not a petition. A phone call. A meeting. A letter.
As pressure vessel and heat exchanger fabricators, we need to continue pushing for protection to be in place for manufacturers of steel products, not just for domestic suppliers of raw material. We encourage every customer and partner in this industry to make that contact.
What This Means for Ward
Nothing changes in our cost structure today. We purchase 80 to 90 percent of our material domestically depending on the project. Our total material spend has increased approximately 10 to 20 percent since Section 232 tariffs were enacted, resulting in a 5 to 15 percent overall unit price increase after labor. We are absorbing what we can. We are passing through what we must.
And we will continue to monitor the evolving situation and update you each month on the latest developments.
The administration has published several tariff fact sheets on the White House website (click here) as the tariff topic has evolved.
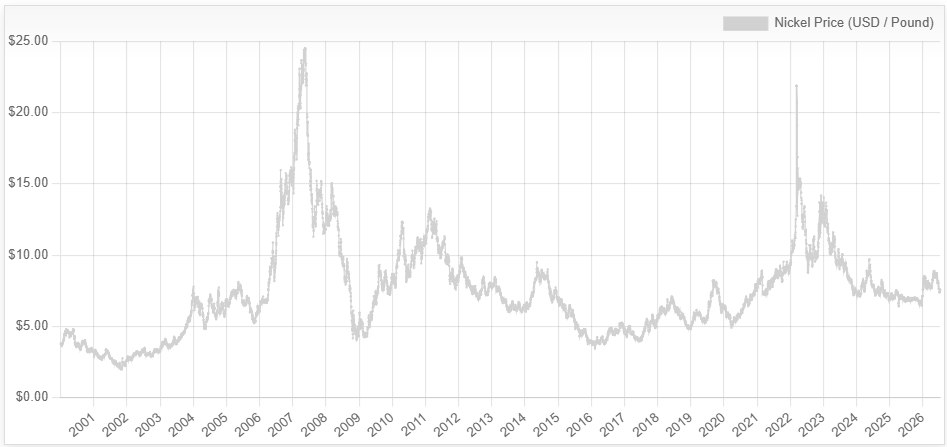
Nickel traded around $7.416 per pound, hovering near its lowest level since late December, as expectations of higher Indonesian supply continued to weigh on market sentiment. Investors remained focused on reports that Indonesia is considering raising its 2026 mining quota to around 360 million tonnes from roughly 260 million tonnes, reversing earlier production curbs that had lifted prices at the start of the year and reviving concerns over global oversupply. The bearish outlook was further reinforced by Nickel Industries’ plans to ramp up production at its new Excelsior Nickel Cobalt HPAL plant while expanding downstream processing capacity through additional HPAL investments, supporting expectations of higher future nickel output. Meanwhile, elevated LME and SHFE nickel inventories continued to signal ample refined metal supply, limiting any sustained price recovery.
Plate mill plate lead times (weeks):
Domestic:
Stainless & Duplex: 12 to 13 (no change)
Nickel Alloys: 7 to 12 (previously 4 to 14)
Carbon steel: 13 to 17 (no change)
*Keep in mind, some plates will exceed the estimated ranges depending on the mill’s production schedule and slab availability. *
Welded tubing lead times (weeks):
Domestic:
Carbon: 6 to 16 (no change)
Stainless: 8 to 18 (no change)
Nickel Alloy: 8 to 18 (no change)
Import:
Carbon: 14 to 25 (no change)
Stainless: 16 to 30 (no change)
Nickel Alloy: 16 to 42 (no change)
Seamless tubing lead times (weeks):
Domestic:
Carbon: 6 to 26 (no change)
Stainless: 8 to 26 (no change)
Nickel Alloy: 8 to 18 (no change)
*Lead times are accurate if bar is in stock. If not, lead times can increase to 44 weeks as most bars are of foreign melt. *
ASME head lead times (weeks):
Domestic:
Stainless: 6 to 16
Nickel Alloys: 6 to 16
Carbon steel: 9 to 16
*Keep in mind, some heads will fall outside the listed ranges depending on the alloy and size/thickness. Some head vendors stock common sizes (under 72” OD) and alloys, allowing them to ship next day. *
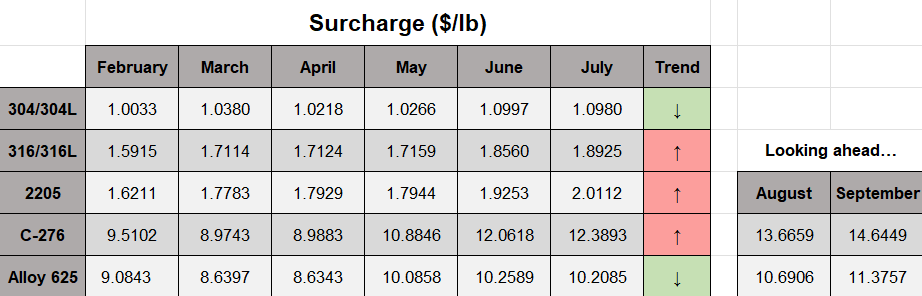
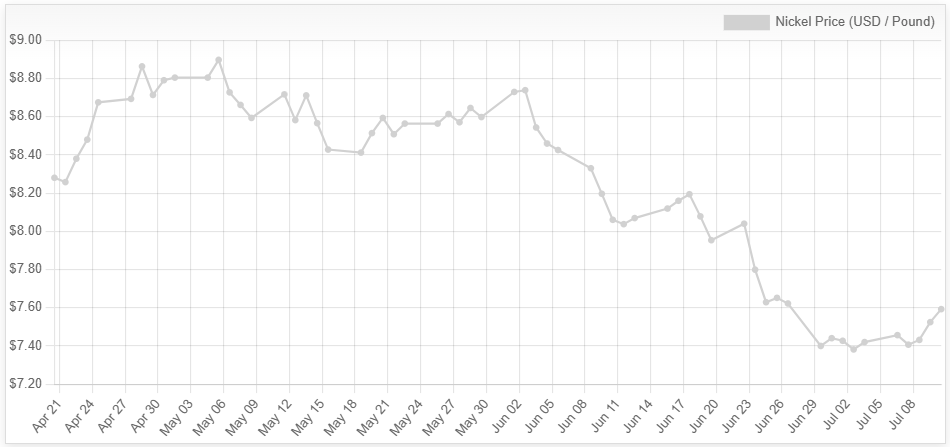
Nickel Prices have had an interesting ride over the past three decades, with a low of $2.20/lb. in October 2001 (following the September 11 events) and a high of $23.72/lb. in May 2007. Surcharges trail Nickel prices by approximately two months, so they would have been at their lowest in December 2001 (304 was $0.0182/lb.) and peak in July 2007 (304 was $2.2839/lb.).